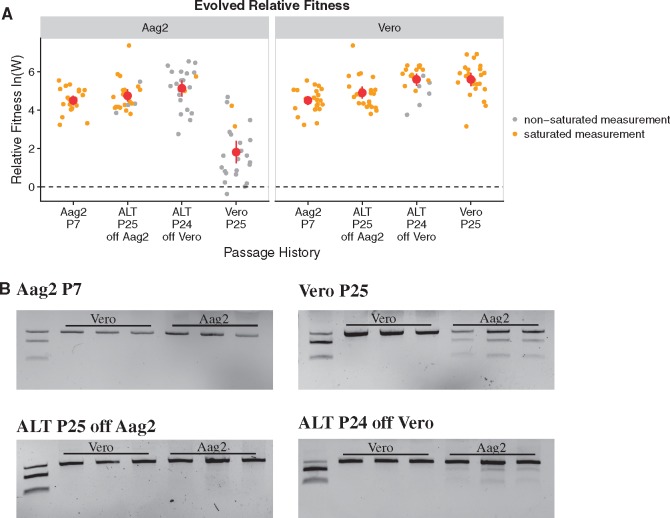
Figure 3.
Fitness of passaged virus populations on Aag2 and Vero cells. (A) Fitness of passaged virus populations relative to the SacII-ΔDR1/2 competitor is shown with mean and 95% CI marked in red. ln(W) values above zero indicate an increase in fitness relative to the ancestor. Values colored in orange are saturated measurements, and indicate a low bound based on the sensitivity of the fitness assay. (B) Representative examples of fitness assay gels from each treatment. In each lane, the top band is from the passaged virus (uncut by SacII), and the bottom two bands are from the SacII-ΔDR1/2 competitor (cut by SacII). The first lane in each gel shows the input mixture at the start of the competition, followed by the output at 48 hpi from three competitions on Vero cells and three competitions on Aag2 cells. Lanes where only the uncut band is visible are saturated measurements.

