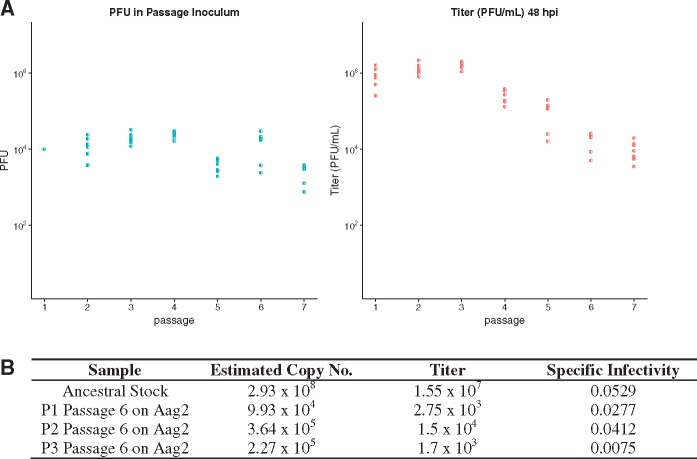
Figure 4.
Declining virus titers during Aag2 passage. (A) Declining virus titers for eight populations passaged on Aag2 cells. The right panel shows measured titers from plaque assays on BHK cells 48 hpi. The left panel shows estimated inoculum size for each passage. (B) Estimates of specific infectivity for the ancestral virus stock used to initiate experimental passage and three populations (P1, P2, and P3) after six passages on Aag2 cells. Copy number was estimated by quantitative PCR, and titer is from plaque assays on BHK cells.

