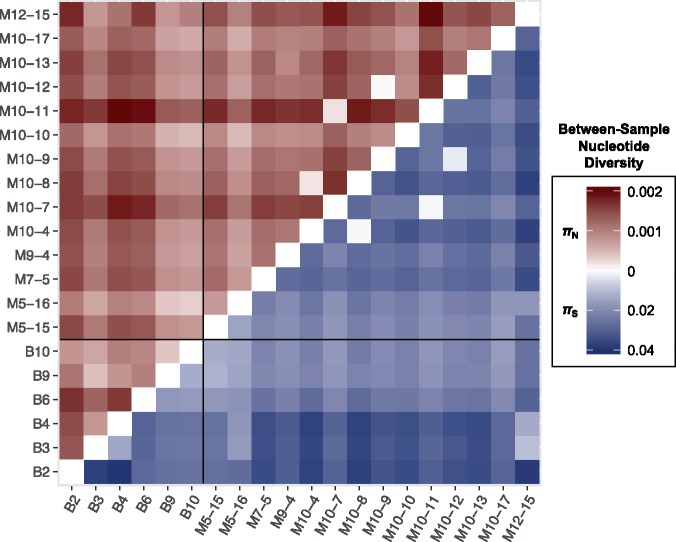
Figure 5.
Inter-sample (between-group) nonsynonymous (red; above the diagonal) and synonymous (blue; below the diagonal) nucleotide diversity (π) for all 190 pairs of 20 intrahost samples. Bird versus bird comparisons are shown on the bottom left, mosquito versus mosquito comparisons on the top right, and bird versus mosquito comparisons on the top left and bottom right quadrants. Note that the scales of πN and πS differ by approximately an order of magnitude.

