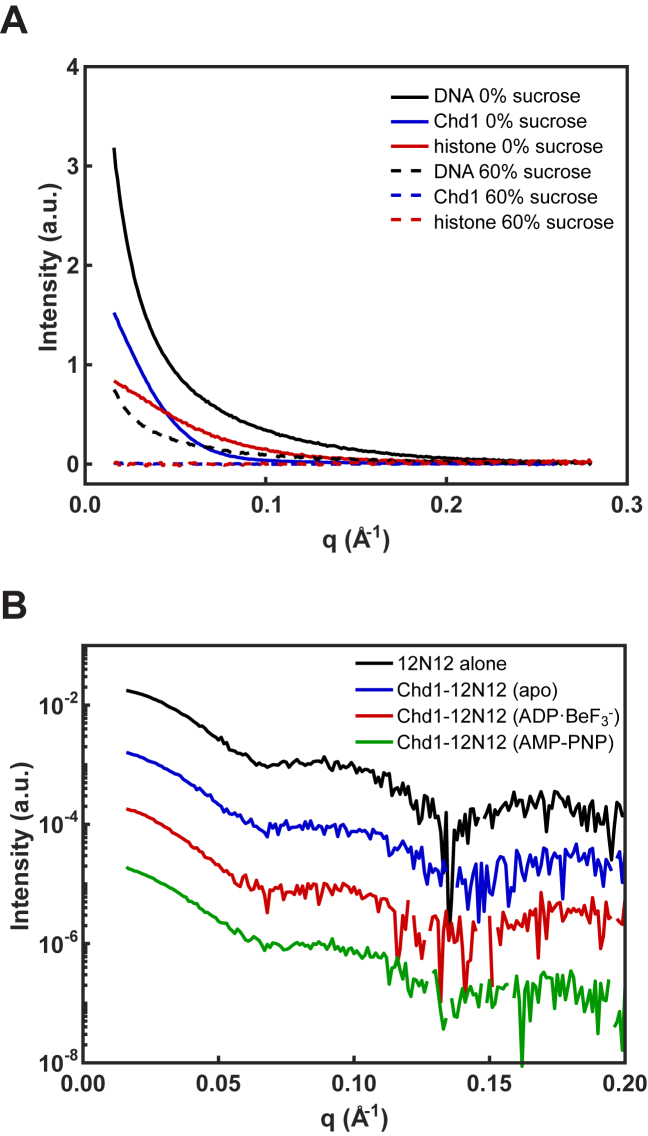
Figure 3.
Protein contrast matching was achieved with 60% sucrose. (A) SAXS signals are shown for DNA, Chd1, and histone octamer measured separately with 0% and 60% sucrose. In 0% sucrose, DNA (solid black), Chd1 (solid blue), and histone (solid red) have distinct scattering profiles. In 60% sucrose, the DNA signal (dashed black) is reduced by a factor of ≈4, but scattering signals from Chd1 (dashed blue) and histone (dashed red) vanish. (B) SAXS profiles measured in 60% sucrose for 12N12 alone (in ADP·BeF3– conditions, black), and Chd1–12N12 complex in apo (blue), ADP·BeF3– (red) and AMP–PNP (green).

