Figure 4.
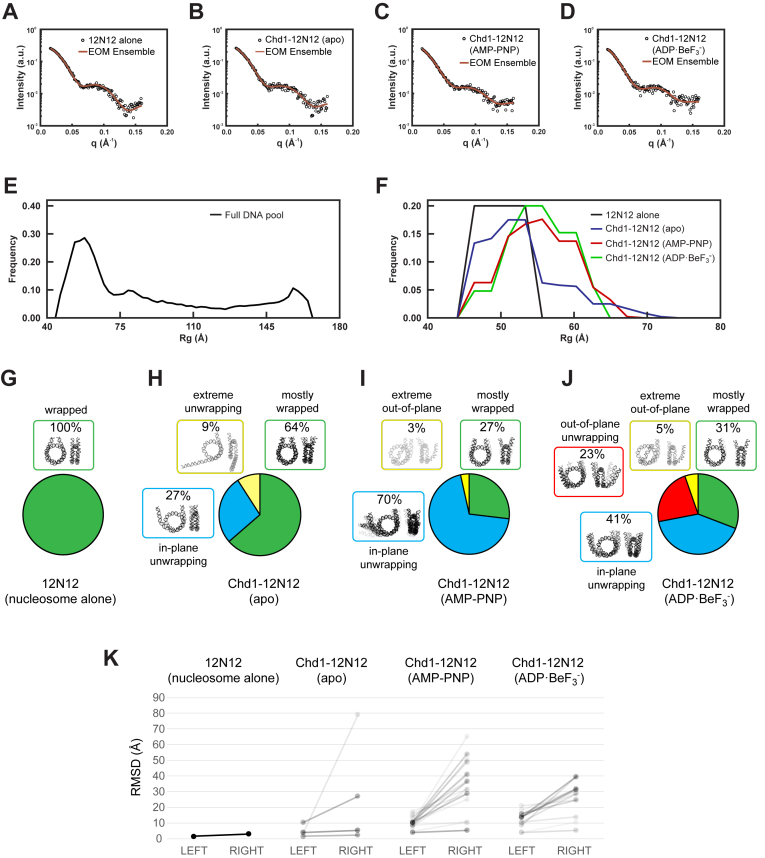
Representative ensembles for Chd1–12N12 complexes in different nucleotide states. (A–D) SAXS data and EOM fits for nucleosome alone (12N12, in ADP·BeF3– buffer), and the Chd1–12N12 complex in apo, AMP–PNP, and ADP·BeF3– conditions, respectively. (E–F) Rg distributions for the DNA pool (E) and the selected ensembles (F) for nucleosome alone (12N12, black) and Chd1–12N12 complex in the apo (blue), ADP·BeF3– (red), and AMP–PNP (green) conditions. (G–J) DNA structures selected by EOM for 12N12 alone and Chd1–12N12 complexes in different nucleotide states. Structures were organized by color according to characteristic features. Unwrapping was classified according to the predominantly unwrapped side. In each cluster, the DNA is shaded according to its weight in the EOM-selected pools. (K) Most partially unwrapped models selected by EOM are asymmetric. The RMSD for backbone phosphate atoms was calculated for each half of each model compared to an idealized and symmetrically wrapped nucleosome. In this representation, each model is shown as a line connecting two points, with the left side reporting the lesser deviation and right side the greater deviation from the wrapped standard. The slopes of the connecting lines highlight the degree of asymmetry for each model. Shading reflects the weighting of each model in the EOM pools.

