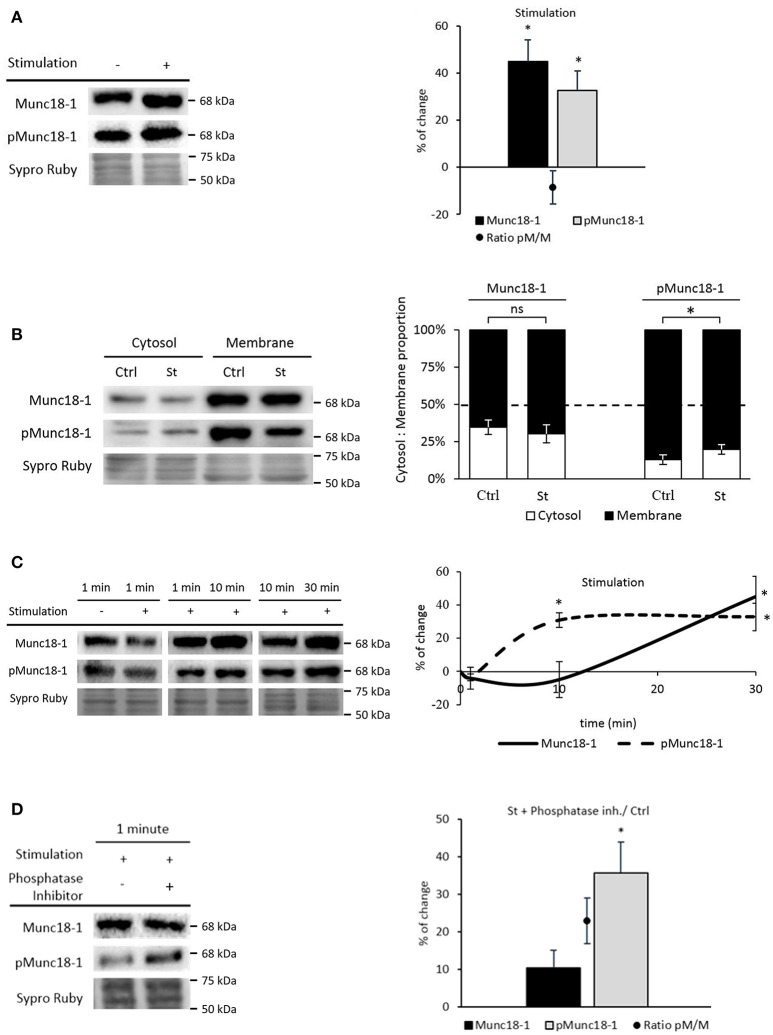
Figure 3.
Synaptic activity increases Munc18-1 phosphorylation in the NMJ. (A) Representative Western blot bands and quantification show that both Munc18-1 and pMunc18-1 increase after stimulation without contraction regarding to basal conditions. (B) Representative Western blot bands and quantification show that pMunc18-1 increases in the cytosol fraction while Munc18-1 does not change after stimulation without contraction regarding to basal conditions. (C) Representative Western blot bands and their representation show Munc18-1 and pMunc18-1 modulation through different stimulation times without contraction. While Munc18-1 progressively increases from 10 to 30 min, pMunc18-1 reaches its maximum at 10 min, which is sustained until 30 min. (D) Representative Western blot bands and quantification show Munc18-1 and pMunc18-1 after 1 min of presynaptic stimulation treatment preincubated with phosphatase inhibitors. The pMunc18-1 levels and pMunc18-1/Munc18-1 ratio significantly increase. Data are mean percentage ± SEM, *p < 0.05 (n = 5).

