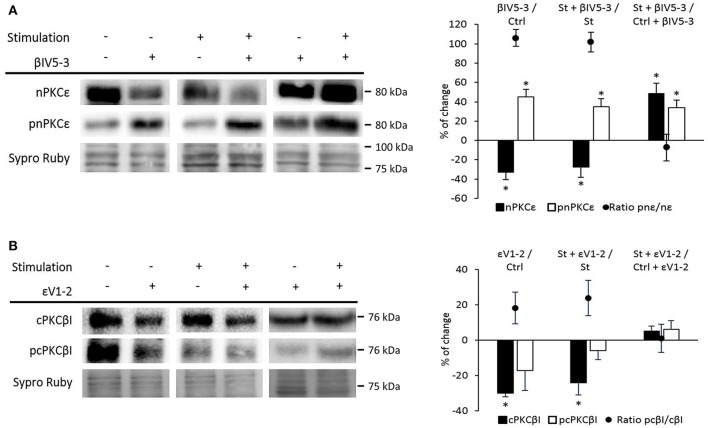
Figure 6.
Relation between nPKCε and cPKCβI. (A) Representative Western blot bands and quantification show that both (βIV5-3/Ctrl: muscles in basal conditions vs. preincubated with βIV5-3 peptide) and (St+βIV5-3/St: synaptic activity compared with the βIV5-3 peptide), the ratio pnPKCε/nPKCε significantly increases. Moreover, in (St+βIV5-3/Ctrl+βIV5-3: basal conditions compared with stimulated samples; both treated with βIV5-3 peptide) both nPKCε and pnPKCε significantly increase. (B) Representative Western blot bands and quantification show that in both (εVI-2/Ctrl: muscles in basal conditions vs. preincubated with εVI-2 peptide) and (St+εVI-2/St: synaptic activity compared with the εVI-2 peptide) the cPKCβI total levels significantly decreased, being the ratio pcPKCβI/cPKCβI in this last condition significantly increased. Data are mean percentage ± SEM, *p < 0.05 (n = 5).

