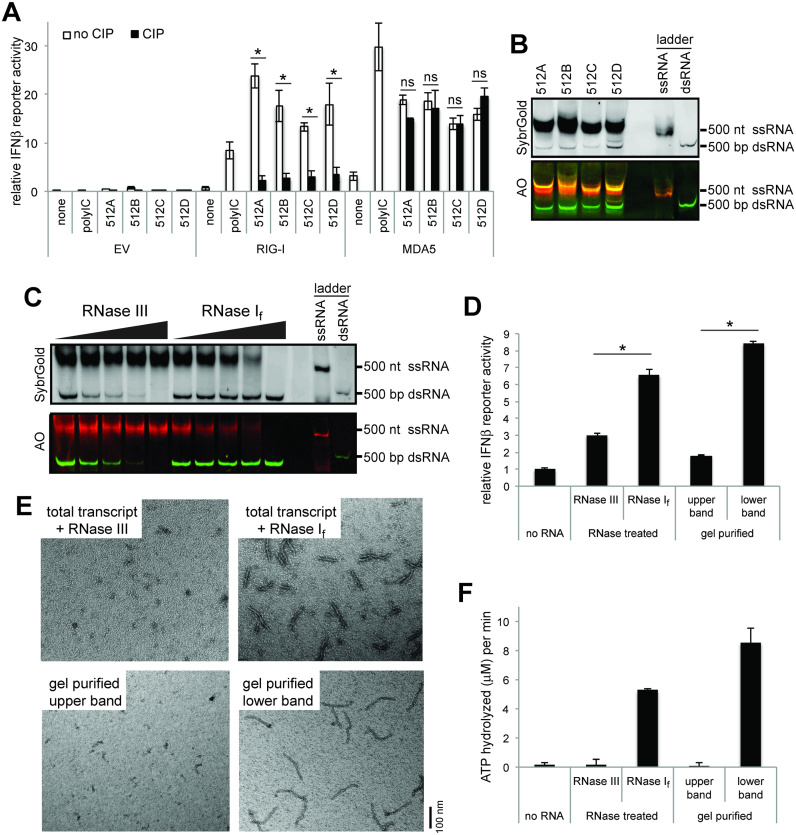
Figure 1.
T7 pol generates MDA5-stimulatory dsRNAs from templates designed to encode ssRNAs. (A) IFNβ promoter-driven dual luciferase assay (mean ± S.D., n = 3 biological replicates). * and ns indicate P< 0.05 and P> 0.05, respectively (one-tailed, unpaired t test, comparing values with and without CIP). 293T cells were transiently transfected with the plasmids expressing human RIG-I or MDA5 (or empty vector control, EV), and stimulated with T7 transcripts for 512A, 512B, 512C and 512D. The RIG-I- and MDA5-stimulatory activities were measured by the dual luciferase activity. The stimulatory activity was compared before and after CIP treatment to examine the effect of 5’ppp. (B) Native PAGE analysis of T7 transcripts for 512A, 512B, 512C and 512D. RNAs were visualized by SybrGold staining (upper panel) and Acridine Orange (AO) staining (lower panel). The 500 nt ssRNA and 500 bp dsRNA markers were used as controls. (C) RNase-susceptibility analysis. The T7 transcript for 512B was treated with an increasing concentration of RNase If (1/40, 1/20, 1/14 and 1/6 units/μl) or RNase III (1/4500, 1/3000, 1/2000 and 1/1000 units/μl), and was analyzed by native PAGE. D. MDA5-stimulatory activity of upper and lower bands of the transcript for 512B, as measured by IFNβ promoter-driven dual luciferase assay (mean ± S.D., n = 3 biological replicates). * indicates P< 0.05 (one-tailed, unpaired t test). The upper and lower bands were isolated by either RNase If/III digestion or gel purification, and their MDA5-stimulatory activities were measured as in (A). All RNAs were treated with CIP to suppress the endogenous RIG-I activity. (E–F) MDA5-stimulatory activity of upper and lower bands of 512B, as measured by MDA5 filament formation (E) and ATP hydrolysis (F) (mean ± S.D., n = 3 biological replicates). Both assays were performed using the RNA binding domain (MDA5ΔN), which can form filaments and hydrolyze ATP as the full-length protein. Filament formation was detected using 2 ng/ul of RNA and 450 nM MDA5 by negative stain electron microscopy (EM). The ATPase activity was measured using 2 ng/ul of RNA and 500 nM MDA5.

