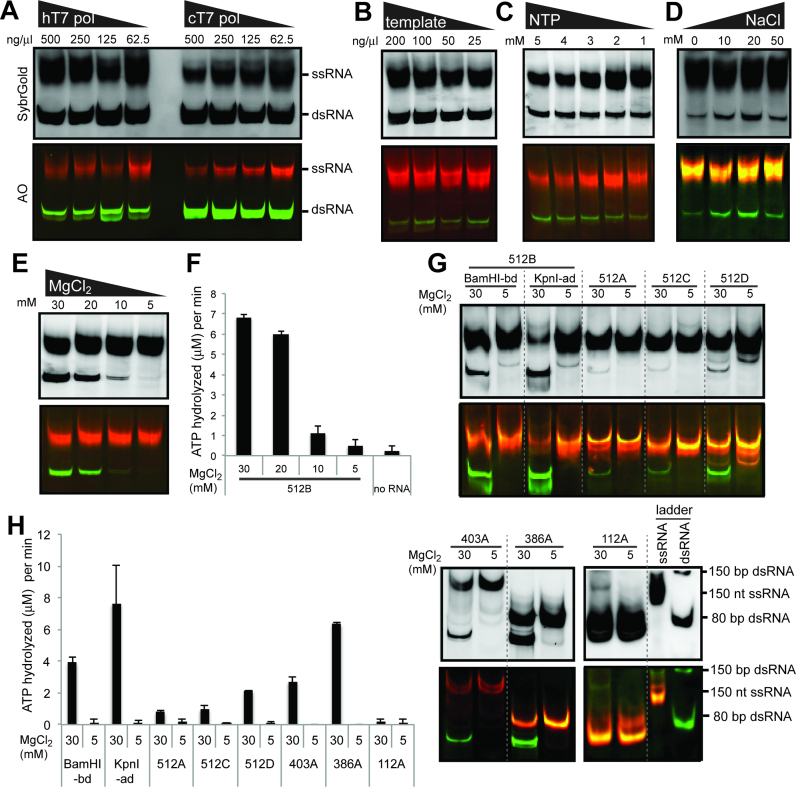
Figure 5.
Impact of the transcription reaction conditions on dsRNA byproduct formation. (A) Native PAGE analysis of the T7 transcripts for 512B prepared using a decreasing concentration of T7 pol. In-house T7 pol (hT7 pol) and commercial T7 pol (cT7 pol, ThermoFisher) were compared. B-E. Native PAGE analysis of the T7 transcripts for 512B prepared using a decreasing concentration of the DNA template (B), NTP (C) and MgCl2 (E), and an increasing concentration of NaCl (D). (F) MDA5 ATPase analysis of the T7 transcripts in (E). (G) Native PAGE analysis of the T7 transcripts for 512B variants (BamHI-bd and KpnI-ad), 512A, 512C, 512D, 403A, 386A and 112A generated using MgCl2 of 30 and 5 mM. See Supplementary Table S1 for the template sequence. Note that for shorter RNAs (∼150 nt), dsRNA migrates more slowly than ssRNA of an equivalent size. (H) MDA5 ATPase analysis of the T7 transcripts in (G) (mean ± S.D., n = 3 biological replicates).

