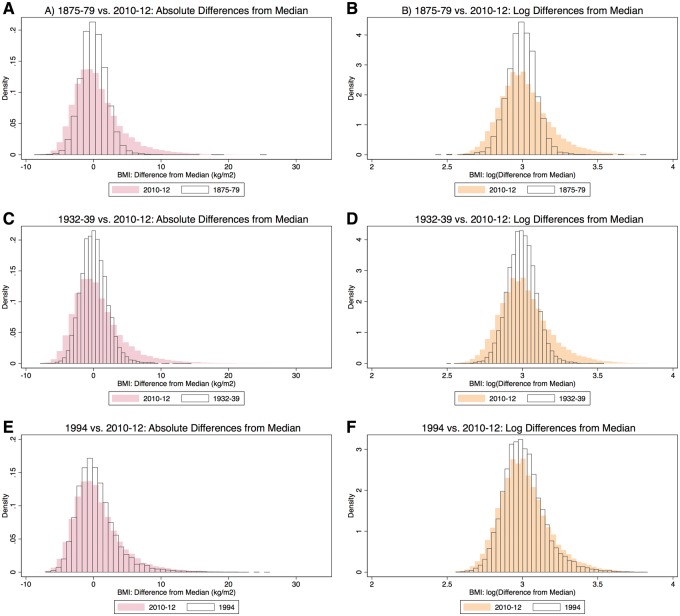
Figure 2.
Comparisons of distributions of absolute differences from the median of BMI (left), and log-transformed differences (right). Modern distributions (2010–12) are in colour. In the top row, 1875–79 is compared to modern data, in the middle row, 1932–39 is compared to modern data and in the bottom row, 1994 is compared to modern data

