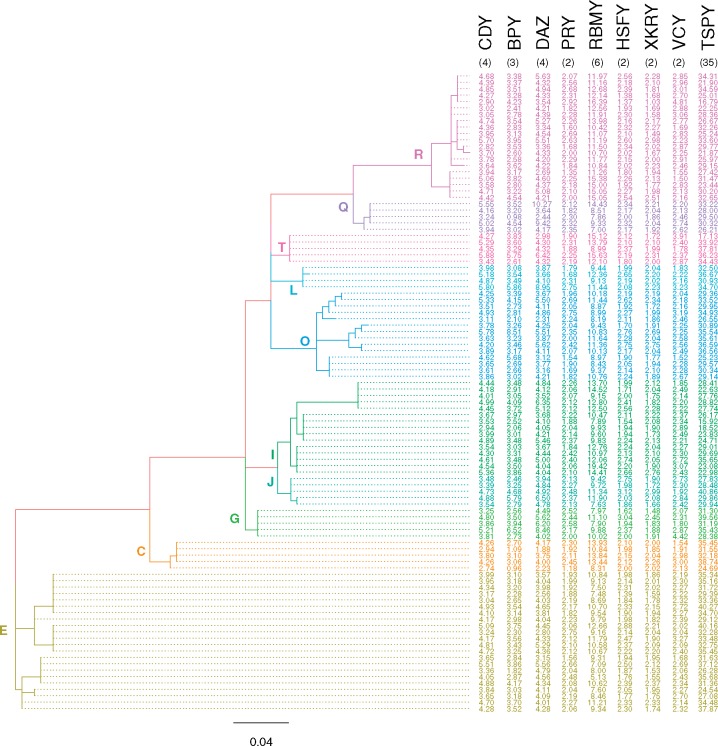
Fig. 2.
—The phylogenetic tree based on Y-chromosomal SNPs. The evolutionary tree was inferred from 187 Y-chromosomal SNPs using maximum likelihood (log-likelihood = -993.63). The branches are colored according to Y haplogroup. Ampliconic gene copy number averaged across replicates after removing one outlier is presented on the right. For comparison, we included the copy numbers for an individual sequenced by Skaletsky et al. (2003; indicated in black font in parenthesis).

