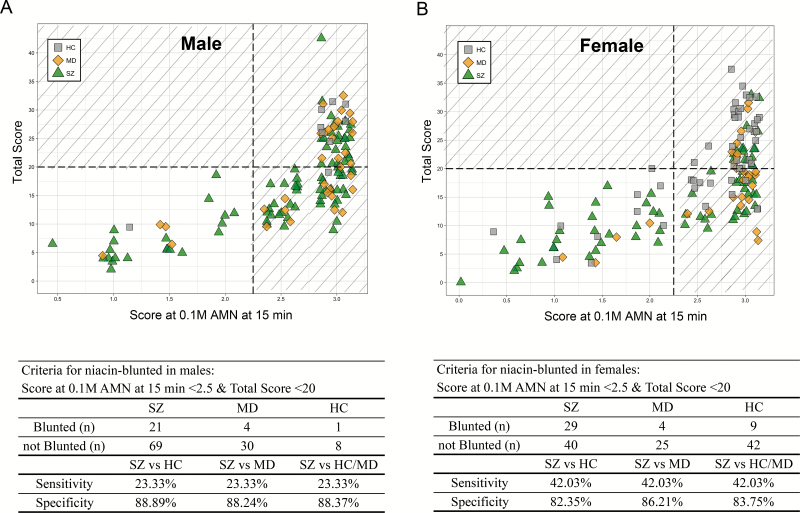
Fig. 3.
Bivariate sample distribution plots of the flush score at 0.1 M AMN at 15 min and the total score for males (A) and females (B), respectively. The points in the plots were properly jittered on the x-axis direction for better demonstration. The grey squares in the plots represent healthy controls; the yellow diamonds represent MD patients; the green triangles represent SZ patients. With a vertical dotted line drawn between 2 and 2.5 of the score at 0.1 M AMN at 15 min, and a horizontal line at 20 of the total score, subjects in the lower left part (the unshaded area) of the plot were identified as niacin-blunted. Related statistics are listed in the tables below the plots.

