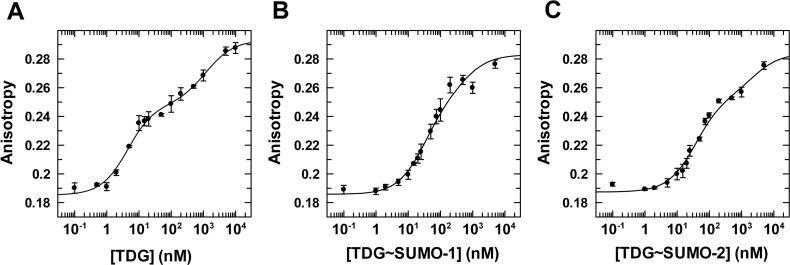
Figure 6.
Equilibrium binding of TDGN140A, unmodified and sumoylated, to G·fC DNA (1 nM) monitored by fluorescence anisotropy. (A) Data for TDGN140A binding to G·fC DNA, fitted to a two-site model gives Kd = 4.0 ± 0.8 nM and Kd2 = 1190 ± 370 nM, and anisotropy values of rD = 0.185 ± 0.002, rED = 0.248 ± 0.003, rEED = 0.293 ± 0.003. (B) Binding of TDGN140A∼SUMO-1 to G·fC DNA yields Kd = 30 ± 4 nM, Kd2 = 560 ± 130 nM, rD = 0.186 ± 0.002, rED = 0.252 (fixed), and rEED = 0.283 (fixed). (C) Binding of TDGN140A∼SUMO-2 to G·fC DNA, fitted to a two-site model, yields Kd = 36 ± 3 nM, Kd2 = 2370 ± 490 nM, rD = 0.187 ± 0.002, rED = 0.253 (fixed) and rEED = 0.284 (fixed). Fitting of TDG∼SUMO-1 and -2 data was performed using a fixed value for rED and rEED (anisotropy of 1:1 and 2:1 complexes, respectively), which were otherwise poorly fitted. The values used for rED were determined using the relationship rED = rD + Δr1:1ave, as described above (Figure 5). The rEED value was determined using the relationship rEED = rD + Δr2:1ave, where Δr2:1ave is the average total anisotropy change associated with forming 2:1 complex TDG∼SUMO-1 and -2 binding to G·T DNA.

