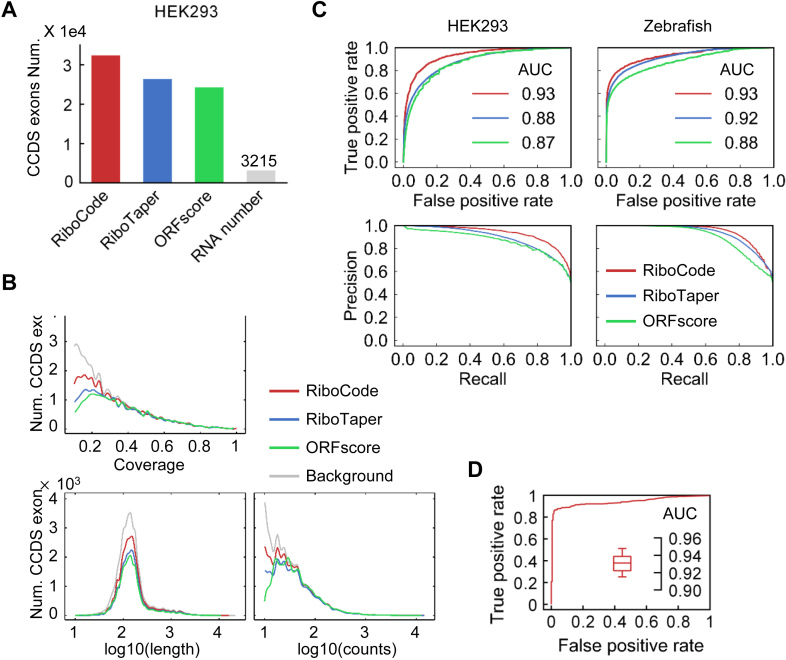
Figure 2.
Performance of RiboCode compared with the de novo methods RiboTaper and ORFscore. (A) The numbers of CCDS exons identified by different methods with the RPF data in HEK293 cells. The cutoffs used for three methods, RiboCode, RiboTaper and ORFscore, were calibrated so that they produced the same numbers of false positives with the RNA-seq data. (B) Distributions of the lengths, total read counts, and coverage of the CCDS exons identified by RiboCode, RiboTaper and ORFscore. (C) ROC and precision curves generated with the results of RiboCode, RiboTaper and ORFscore with two simulation datasets, one generated from the HEK293 cell data in Gao et al. (left) and the other one from the Zebrafish data in Bazzini et al. (right). The P-values of the ROC curve differences between RiboCode and the second best method were provided in Supplementary Figure S2B. (D) A representative ROC curve generated with the results of RiboCode on a simulation dataset specifically for the overlapping ORFs. Such simulation for overlapping ORFs were performed for 20 times, and the box plot inside summarizes the AUC of the 20 ROC curves from the results of RiboCode applied on these 20 datasets.

