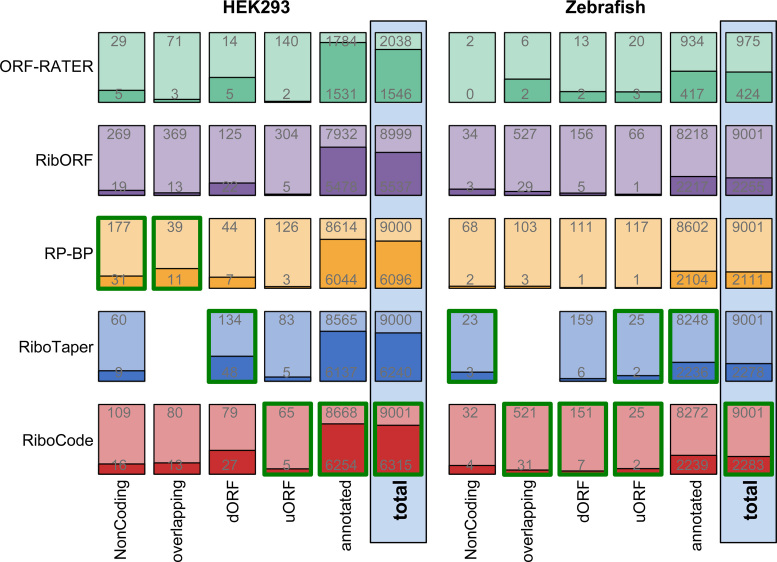
Figure 5.
De novo annotations of the translatomes and validations with MS data. Bar plots showing the proportions of the ORFs that are supported by the MS data of HEK293 cells or Zebrafish. Provided on each of the bar plot are the number of predicted ORFs (top), by a particular method, and the number of ORFs validated with the specific MS data (bottom). The validation results of all the ORFs (total) and the different sub-categories of the ORFs are provided. Under each category of the ORFs (four bars in each column, except ORF-RATER), the one with the highest validation rate was outlined by green color.

