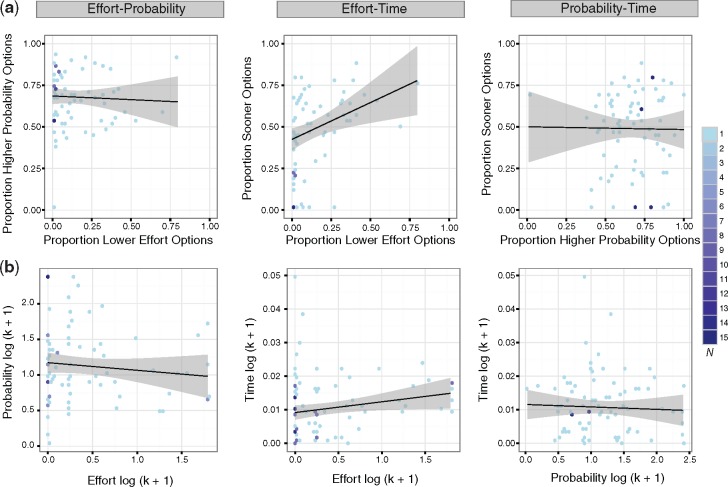
Fig. 3.
Behavioral consistency across decision preferences and discount rates. (a) Robust correlations between decision preferences for effort, probability, and time and (b) between effort, probability, and temporal discount rates (log-transformed). Left: probability over effort; Middle: time over effort; Right: time over probability. Because of their skewed distribution, the discount rates are log-transformed. The color bar on the far right represents the number of individual participants represented by that data point.

