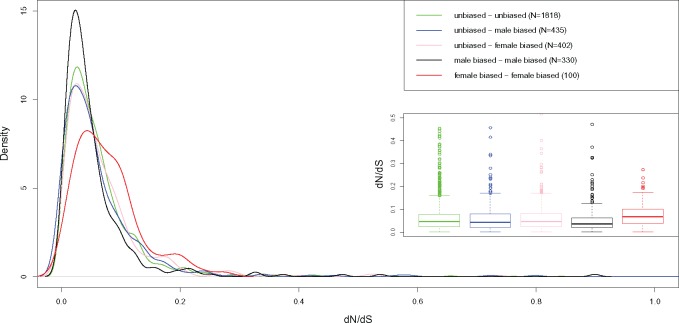
Fig. 2.
—Kernel density plots and boxplots of dN/dS in unbiased genes (green line), in genes that are unbiased in one species and male- or female-biased in the other species (respectively, blue line and pink line) and in genes where the sex bias is maintained (black line for male-biased genes, red line for female-biased genes).

