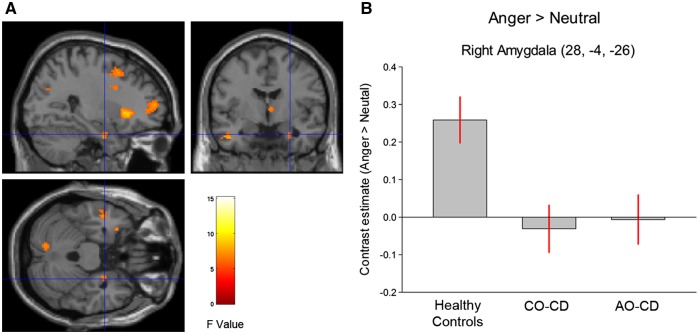
Fig. 1.
(A) Statistical parametric maps displaying the main effect of group for the contrast of angry vs neutral faces. Maps are thresholded at P < 0.005, uncorrected for display purposes only. The color bar shows F values. (B) Bar graphs display mean (± SE) signal change in right amygdala (Anger > Neutral) for all three groups. AO–CD indicates adolescence-onset Conduct Disorder; CO–CD, childhood–onset Conduct Disorder. Both of the Conduct Disorder subgroups showed significantly reduced right amygdala activity relative to healthy controls.

