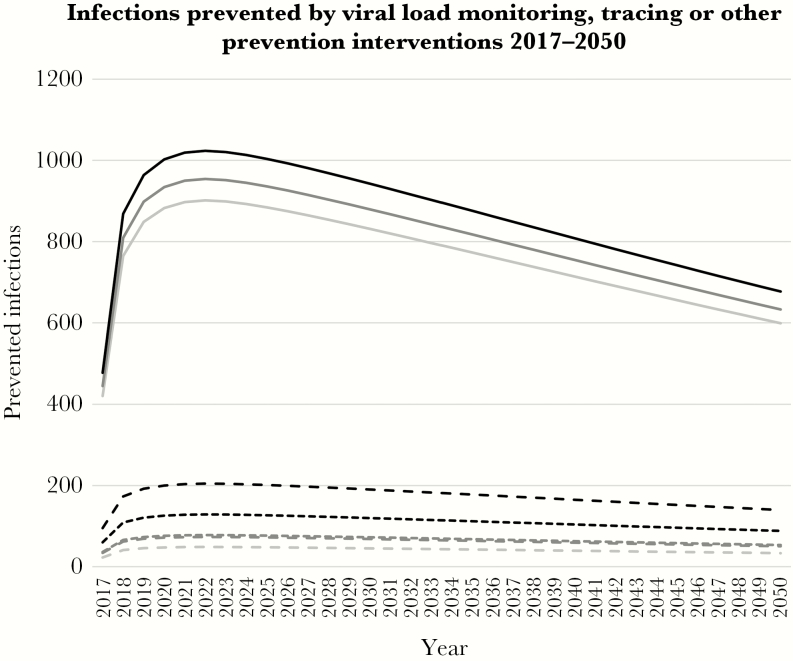
Figure 3.
Number of annual new HIV infections prevented by routine viral load monitoring, tracing patients lost to follow-up, or other retention support interventions in the Universal ART scenario. Light gray, no viral load monitoring; dark gray, 24-monthly viral load monitoring; black, 12-monthly viral load monitoring. Dotted curves, no tracing; dashed curves, tracing patients lost to follow-up; solid curves, no treatment interruptions.

