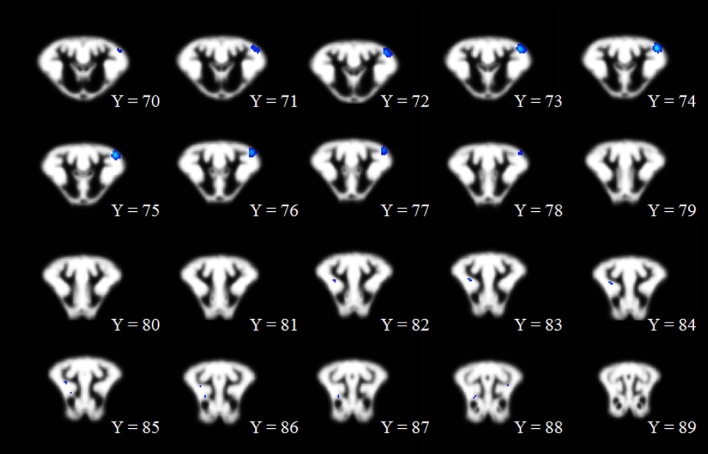
FIGURE 1.
Voxel-based morphometric assessment in which prenatally CS pigs exhibited greater gray matter than did prenatally CD pigs. The range of dark blue to light blue indicates the degree of statistical difference, ranging from pseudo t values of 6.80 to 9.55, respectively. All clusters represented in the figure are significant at a P-corrected value of P < 0.01. Notably, there were no significant clusters in which prenatally CD pigs exhibited greater gray matter than prenatally CS pigs. Within the figure, the changes from Y = 70 to Y = 89 indicate movement from anterior to posterior, respectively, through the brain image slices. CD, choline-deficient; CS, choline-sufficient.

