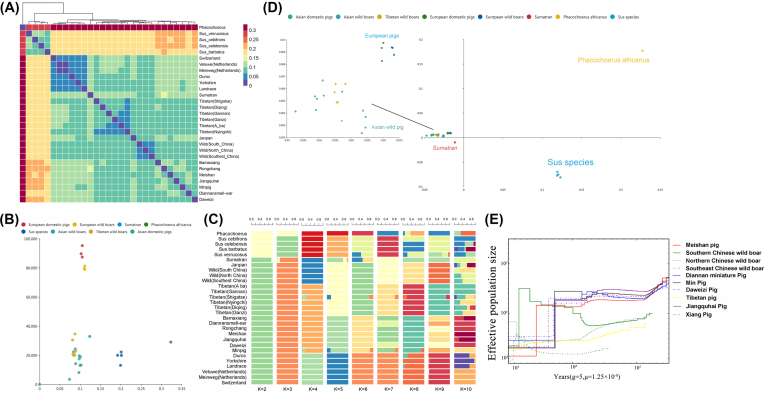
Figure 2:
Population diversity and demographic history of Meishan pigs. A) The heatmap inferring the genetic relationship using SNV data from 29 subspecies. The heatmap was used to reveal the genetic distance between pairwise subspecies. B) Scatter diagram showing the relationship between geographic and genetic distance among 29 subspecies. The X-axis represents the genetic distance and Y-axis represents the geographic distance. C) ADMIXTURE analysis showing clustering of samples from 29 subspecies within K groups. K refers to the number of presumed ancestral groups. D) PCA plot with SNV data. Different colors represent different subspecies. E) Demographic history of Meishan and other Chinese domestic and wild pigs. Generation time (g) = 5 year and transversion mutation rate (u) = 1.25 × 10⁻⁸ mutations per bp per generation.

