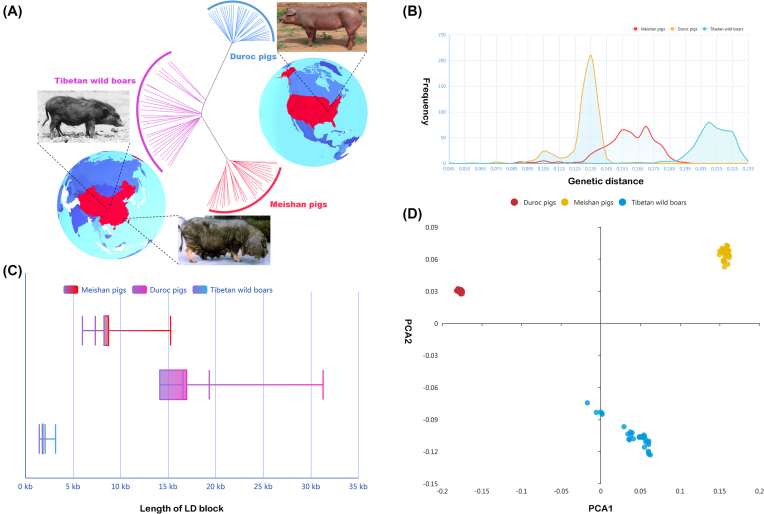
Figure 3:
Genetic relationships and population structure among three pig populations. A) Neighbor-joining phylogenetic tree of three pig populations. The genetic distance is measured by SNV data from Meishan, Duroc, and Tibetan wild boar populations. B) Frequency distribution of genetic distance among three pig populations. The X-axis represents the genetic distance and Y-axis represents frequency. C) Length distribution of LD block among three pig populations. Red, purple, and blue bars represent Meishan, Duroc, and Tibetan wild boar populations, respectively. D) PCA plot for three pig populations with SNV data. Different colors represent different pig populations.

