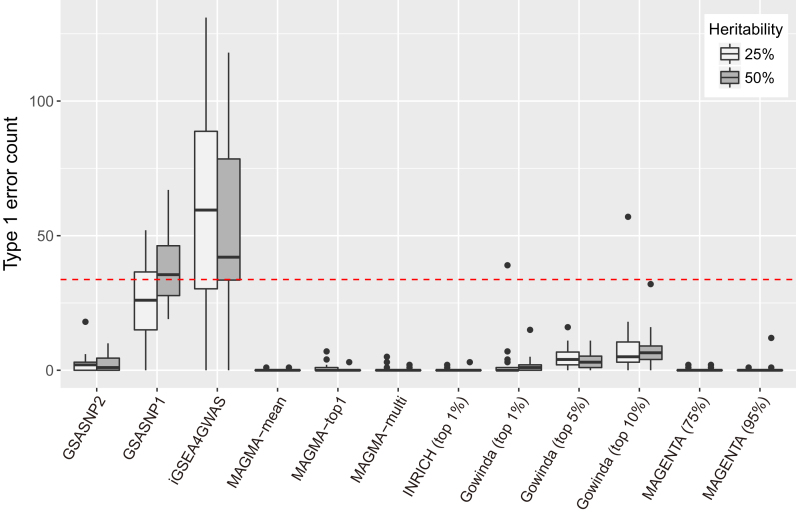
Figure 2.
Comparison of false discovery controls. False discovery counts (FDR < 0.05) for competitive pathway analysis methods are shown. The simulation was performed for two heritability values (25 and 50%) and each simulation was repeated 20 times. MAGMA was tested for three gene models; INRICH was tested for approximately top 1% SNPs; Gowinda was tested for approximately top 1, 5 and 10% SNPs; and MAGENTA was tested for 75 and 95% of enrichment cutoffs. The red dashed line indicates the 5% of the total pathways.

