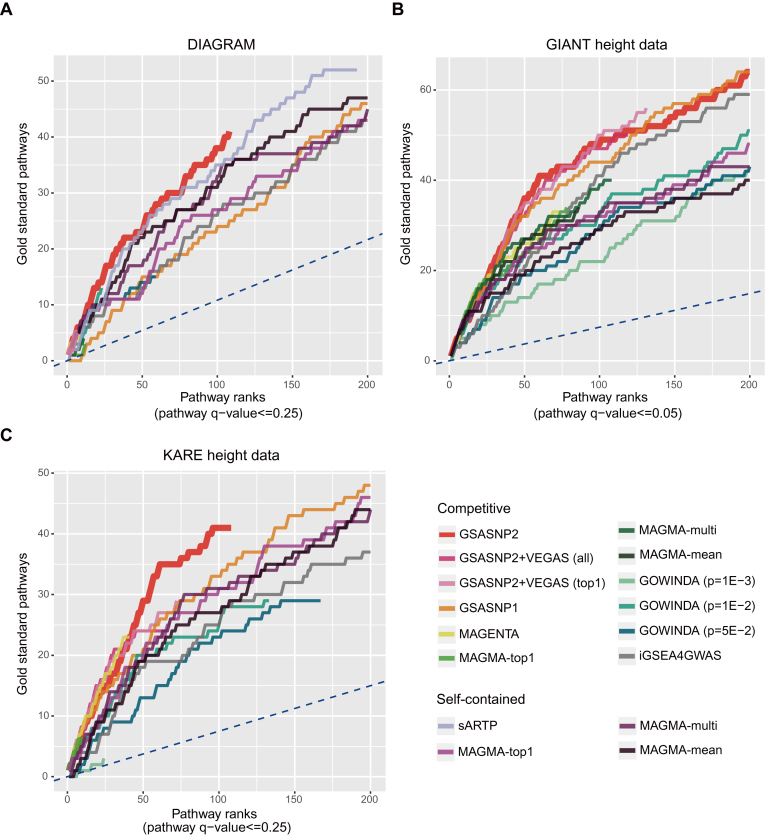
Figure 4.
Performance comparison using real data. For three public GWAS summary datasets from (A) DIAGRAM, (B) GIANT height and (C) KARE height data, the cumulative gold standard pathway counts for competitive and self-contained pathway analysis methods were plotted. The results from INRICH were not represented because it detected only one GS pathway. The blue dashed lines indicate the expected cumulative gold standard pathway counts for random prediction.

