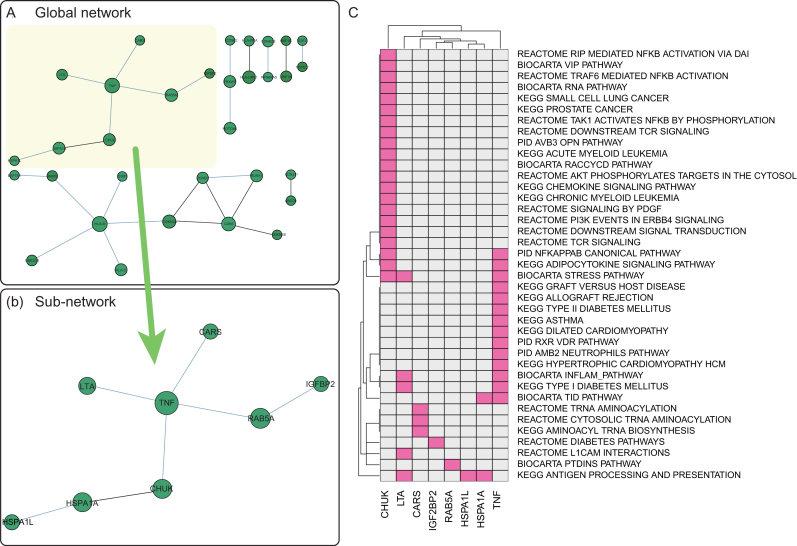
Figure 6.
Gene network (HIPPIE) derived from DIAGRAM data analysis. (A) Global network from significant gene-sets (FDR < 0.25; gene score < 0.01). (B) A sub-network composed of eight nodes from the global network. (C) A heatmap representing the membership of each gene node in the significant pathways.

