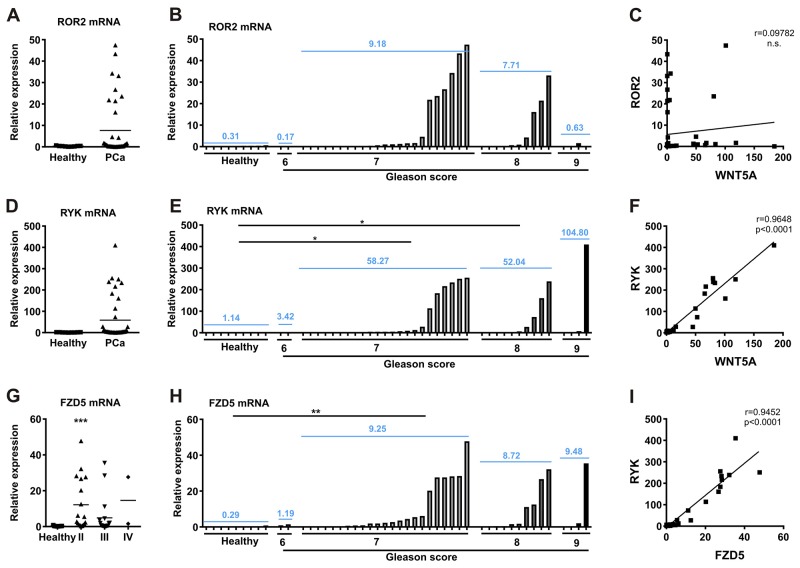
Figure 3. RYK and FZD5 are increased in prostate cancer and show correlating expression patterns.
(A) cDNA prostate cancer array was used to measure (A-B), ROR2; (D-E), RYK; and (G-H), FZD5 expression in different tumor stages of prostate cancer. Tumor stages are stated according to tumor growth (stage II-IV) and degree of differentiation (GS 6-9). (C) No correlation of ROR2 and WNT5A expression in prostate cancer cDNA samples. (F-I) Positive correlation of RYK with WNT5A and FZD5. Expression was analyzed by qPCR and normalized to β-actin. Data are shown as mean (blue). Correlation was calculated using Pearson r correlation analysis and linear regression. *p<0.05; **p<0.01; ***p<0.001 vs. healthy controls.

