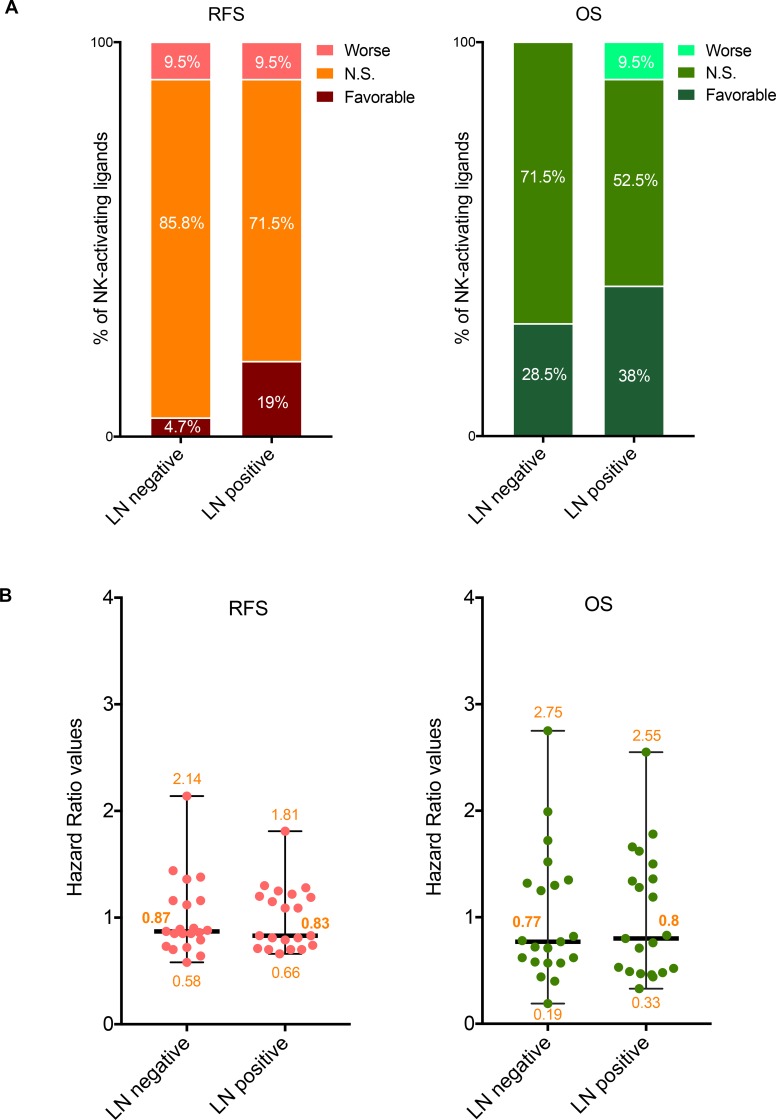
Figure 3. Prognostic values of the mRNA expression of NK-activating ligands depending on the lymph node status.
(A) Percentages of the NK-activating ligands whose high mRNA expression significantly associated (Favorable and Worse) or not (N.S.) with RFS (Left graph) or OS (Right graph) in the different lymph node (LN) statuses. “Favorable“ indicates the association of high mRNA expression with longer RFS/OS, representing good prognosis. “Worse” indicates the association of the high mRNA expression with shorter RFS/OS, representing bad prognosis. “N.S.” indicates no significant association with prognosis. (B) Individual value plots visualizing the distribution of the hazard ratio (HR) values of the NK-activating ligands in LN negative and LN positive BC patients. The bars represent the median, lower and higher HR values for all ligands in each subtype.

