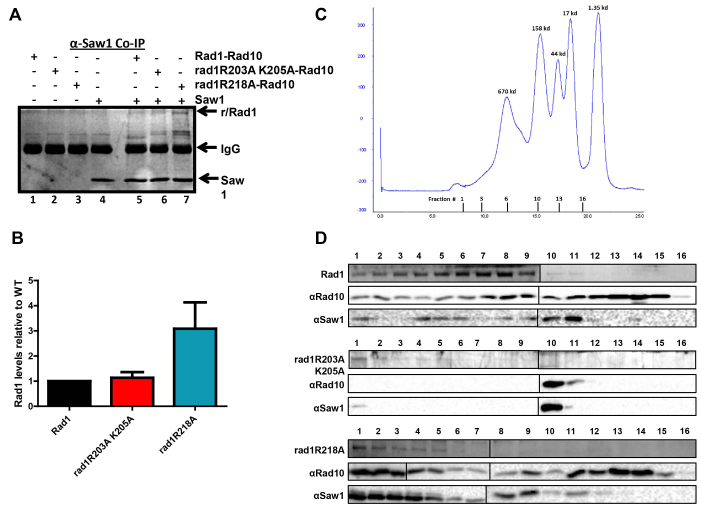
Figure 5.
rad1 complex interactions with Saw1 by co-immunoprecipitation (A, B) and gel filtration (C, D). (A) His–Rad1–Rad10, His–rad1R203A,K205A-Rad10, and His–rad1R218A–Rad10 in the presence of BSA were incubated with (+) or without (–) 6xHis-Saw1. An α-Saw1 antibody was added to each and then pulled down with Protein A/G agarose (Pierce®). The proteins were removed from the beads by boiling and analyzed on an SDS-page (12%) gel, followed by silver stain. His–Rad1/rad1R203A,K205A/rad1R218A and 6xHis-Saw1 are indicated with arrows. (B) The amount of His–Rad1–Rad10, His–rad1R203A,K205A-Rad10 and His–rad1R218A–Rad10 that was pulled down by Saw1 was quantified and internally normalized using Image Lab (Bio Rad). Any non-specific interactions in the absence of 6xHis-Saw1 were also quantified and subtracted from the specific band. In each independent experiment, the amount of His–rad1R203A,K205A-Rad10 (red) and His–rad1R218A–Rad10 (teal) was set relative to His–Rad1–Rad10 (black). Data represents the mean ± SEM of four independent experiments. (C) Elution profile of broad range standards (Bio Rad) through the Superose 6 column (GE Lifesciences). The molecular weights of the standards are indicated in kDa about the curve. The gel filtration fractions from the complex profiles are indicated below the x-axis. The fraction numbers are the same for all three protein complexes. (D) Representative analysis of gel filtration fractions. Fraction numbers start with #1 representing the highest molecular weight fractions following the void. Fractions were analyzed for His–Rad1, His–rad1R203A,K205A, His–rad1R218A (Coomassie stain), Rad10 (western blot), and Saw1 (western blot). The left and right panels from each gel or blot were performed at the same time, in parallel.

