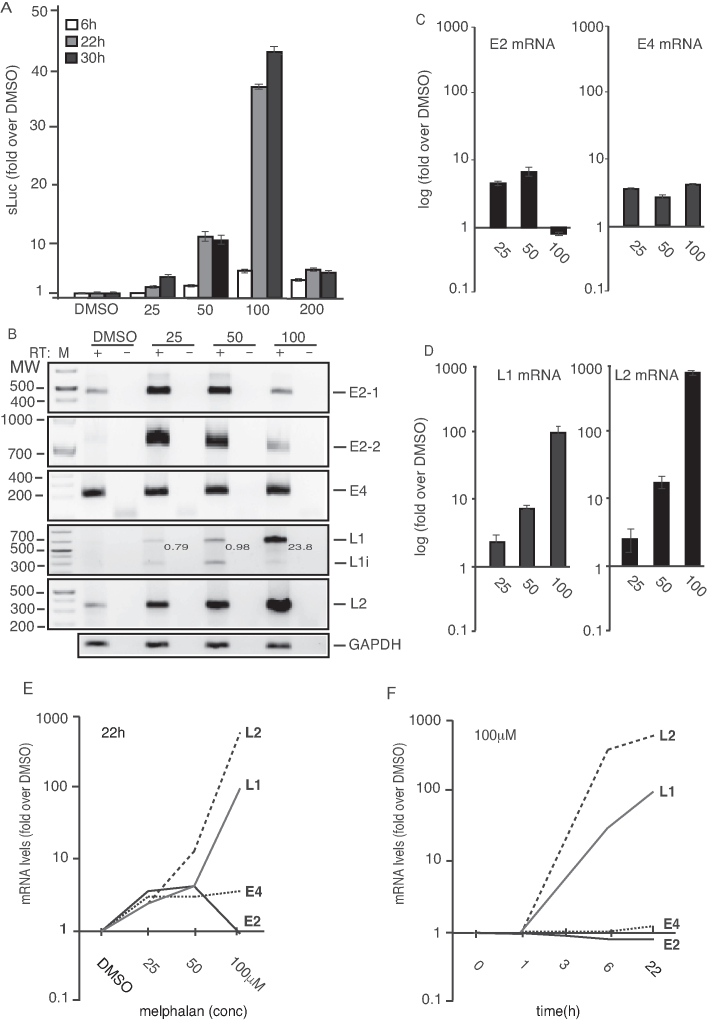
Figure 2.
(A) sLuc enzyme activity in the cell culture medium of reporter cell line C33A2 treated with various concentrations of melphalan for 6-, 22- or 30 h. sLuc activity is displayed as fold over DMSO-treated C33A2 cells at the various concentrations and time points. (B) HPV16 RT-PCR on total RNA extracted from the C33A2 reporter cell line treated with DMSO alone or 25-, 50- or 100-µM of melphalan for 22 h. The RT-PCR reactions were performed in the absence (−) or presence (+) of RT-enzyme. Note that the numbers indicated in the gel picture represent L1/L1i ratios in the various lanes. (C and D) RT-qPCR on the cDNA samples used for RT-PCR in Figure 2B. Results are displayed as fold over DMSO-treated C33A2 cells at the various concentratiosns. Note the log-scale on the y-axis. (E and F) RT-qPCR of HPV16 L1, L2, E4 and E2 mRNAs on total RNA extracted from the C33A2 reporter cell line treated with DMSO alone or various concentrations of melphalan for 22hrs (E), or with 100 µM of melphalan for various time points (F). Results are displayed as fold over DMSO-treated C33A2 cells at the various concentrations. Note the log-scale on the y-axis.

