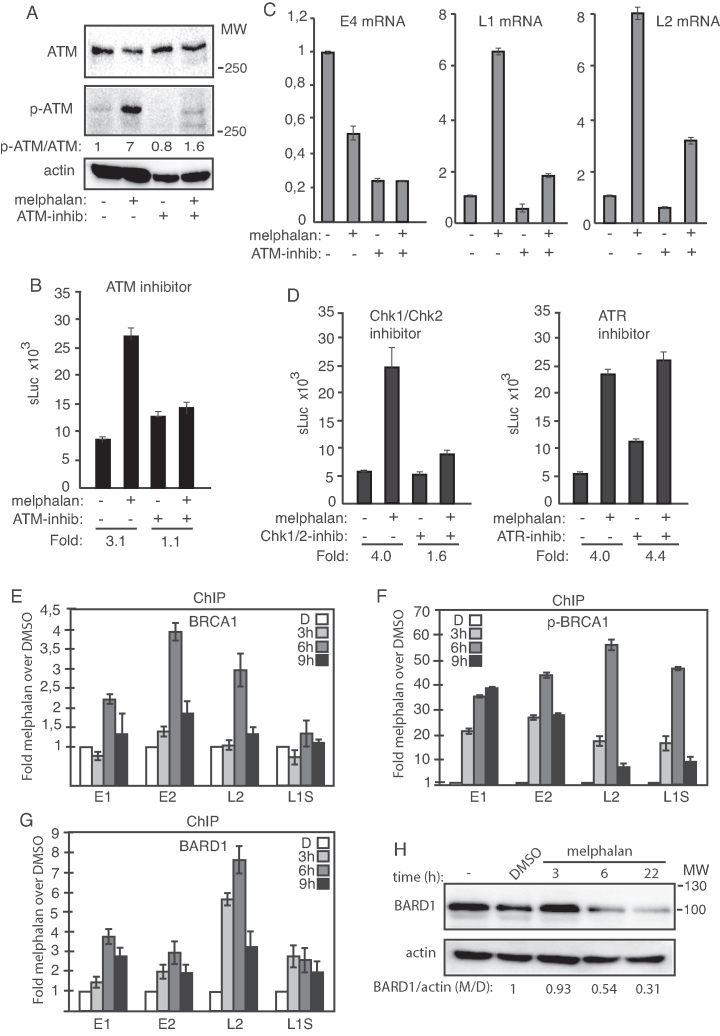
Figure 4.
(A) Western blots with monospecific antibodies to ATM, phosphorylated ATM or actin in C33A2 cells treated for 3 h with DMSO (−) or 100 µM melphalan (+) in the absence (−) or presence (+) of 10 µM ATM inhibitor. Ratios of phosphorylated ATM (p-ATM) over ATM are shown below the gels. Ratio of pATM over ATM in untreated cells was set as 1. (B) sLuc activity produced by C33A2 cells treated with DMSO (−) or melphalan (+) in the absence (−) or presence (+) of 10 µM ATM inhibitor KU-60019 sLuc activity was monitored 6 h after addition of melphalan to the C33A2 cells. Note that graphs display sLuc activity in the absence or presence of melphalan or melphalan in the absence or presence of kinase inhibitor. Fold induction of sLuc in the absence or presence of melphalan is shown below the graphs. (C) RT-qPCR of HPV16 E4, L1 or L2 mRNAs in total RNA extracted from the C33A2 reporter cell line treated with DMSO (−) or 100 µM melphalan (+) in the absence (−) or presence (+) of 10 µM ATM inhibitor. RNA was extracted 3 h after addition of melphalan to the C33A2 cells. (D) sLuc activity in C33A2 cells treated with DMSO (−) or 100 µM melphalan (+) in the absence (−) or presence (+) of 12.5 µM Chk1/Chk2 inhibitor AZD7762 (left panel), or in the absence (−) or presence (+) of 10 µM ATR inhibitor VE-821 (right panel). Note that graphs display sLuc activity in the absence or presence of melphalan or melphalan in the absence or presence of kinase inhibitor. Fold induction of sLuc in the absence or presence of melphalan is shown below the graphs. (E–G) ChIP analyses on C33A2 cells using antibodies to proteins indicated in each histogram and qPCR of the indicated HPV16 amplicons. Mean values with standard deviations of the amount of immunoprecipitated DNA compared to input DNA are displayed. The qPCR values obtained for each primer pair with DNA extracted from DMSO-treated C33A2 cells were set to 1 to correct for differences between different ChIP extracts. Chip extracts were prepared from C33A2 cells treated with 100 µM melphalan for the indicated time-periods. All samples were analyzed in two independent ChIP assays and all qPCR reactions were performed in triplicates. (H) Western blot on BARD1 in C33A2 cells or C33A2 cells treated with DMSO or 100 µM melphalan for the indicated time points. BARD1 levels were normalized to actin and BARD1 over actin in untreated cells was set as 1.

