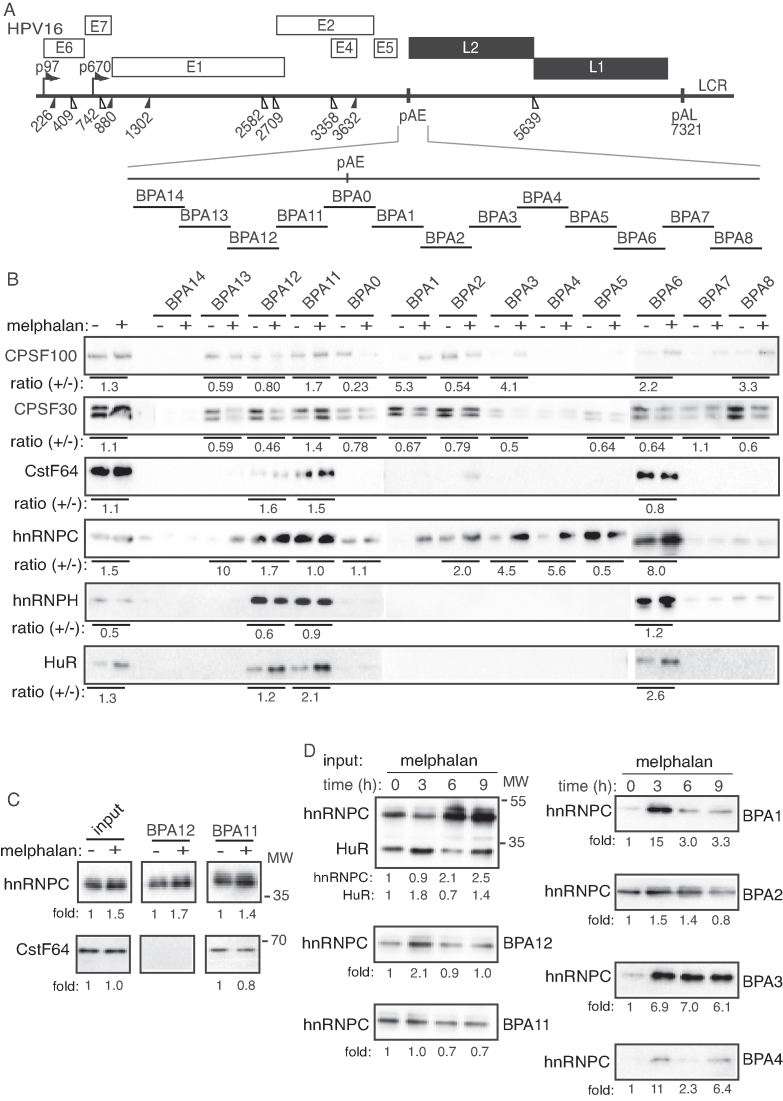
Figure 7.
(A) Schematic drawing of the HPV16 genome with a blow-up of the region around the HPV16 early polyadenylation signal pAE. The 35-nt biotinylated ssDNA oligos (overlapping by 5-nt) used in pull down assays are indicated. (B) Western blot with antibodies to the indicated polyadenylation factors and RNA binding proteins pulled down with the indicated biotinylated oligos using cellular extracts prepared from C33A2 cells treated with DMSO (−) or melphalan (+) for 6 h. Ratios of quantified levels of the various pulled down proteins in melphalan treated cells (+) over levels of pulled down protein in DMSO-treated cells (−) are shown below the gel. (C) Western blot on pull-down with biotinylated RNA oligos. Ratios of quantified levels of hnRNP C or CstF64 pulled down in melphalan treated cells (+) over levels of pulled down proteins in DMSO-treated cells (−) are shown below the gel. (D) Western blot with antibody to hnRNP C on proteins pulled down with the biotinylated oligos using cellular extracts prepared from C33A2 cells treated with melphalan for the indicated time periods. Ratios of hnRNP C levels in melphalan treated cells at various time points over levels of pulled down hnRNP C in C33A2 cells treated for 0 h are shown below the gels.

