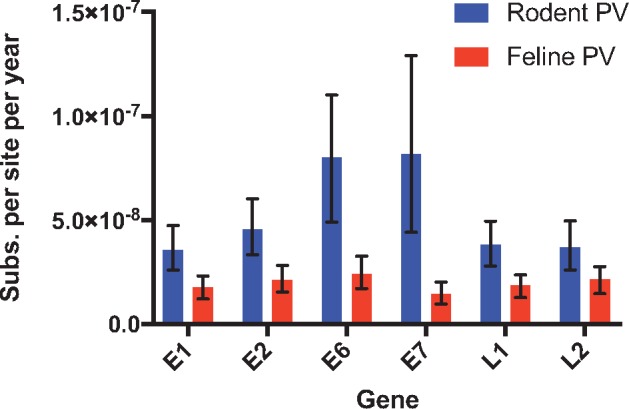
Figure 4.

Mean estimates of rodent PV substitution rates compared with previously estimated rates of evolution in feline PVs across six genes. Bars represent 95% CIs. Estimates were based on a relaxed lognormal clock model implemented in BEAST. Calibration was based on previously reported estimates of host divergence times.
