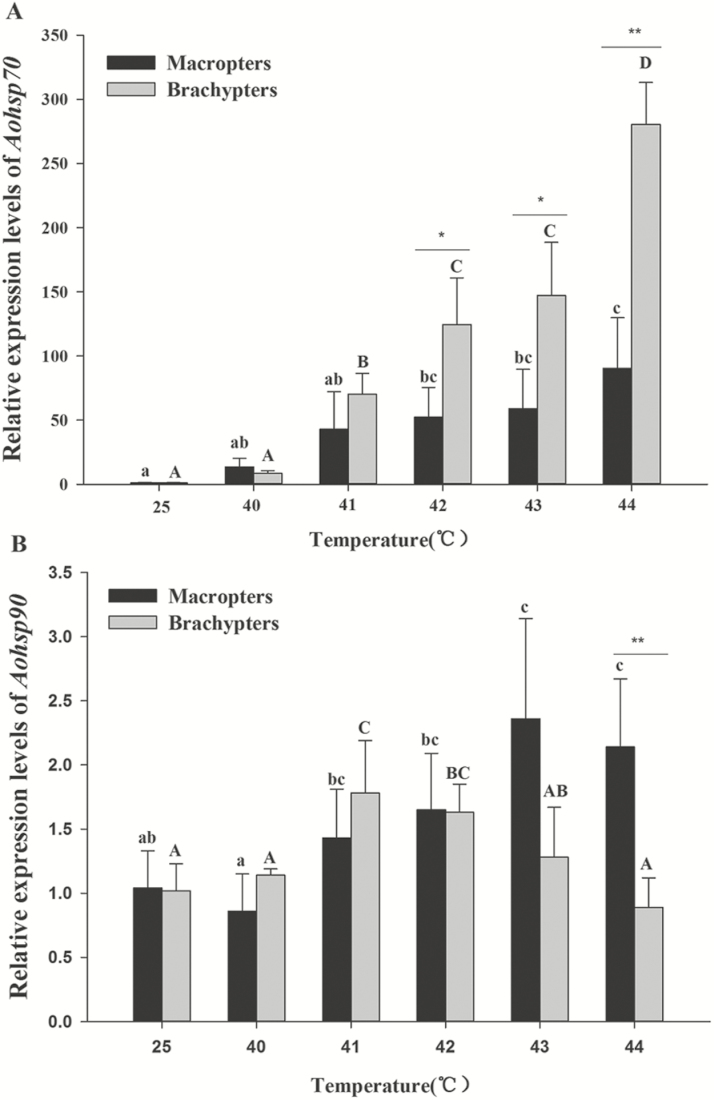
Fig. 8.
Relative expression levels of Aohsp70 (A) and Aohsp90 (B) in adults exposed to each test temperature for 2 h (40–44°C). Expression levels were first normalized to the aboundance of the reference gene, ß-actin, and then to the 25°C control. The different letters on the error bars indicated significant difference at the 0.05 levels (Tukey’s test). The capital letters represented macropters and the lower-case letters represented brachypters. The asterisks above the bars indicated a significant differences between the two morphs (t-test, *0.001 < P < 0.01 and **P < 0.001). Data were presented as mean ± SE.

