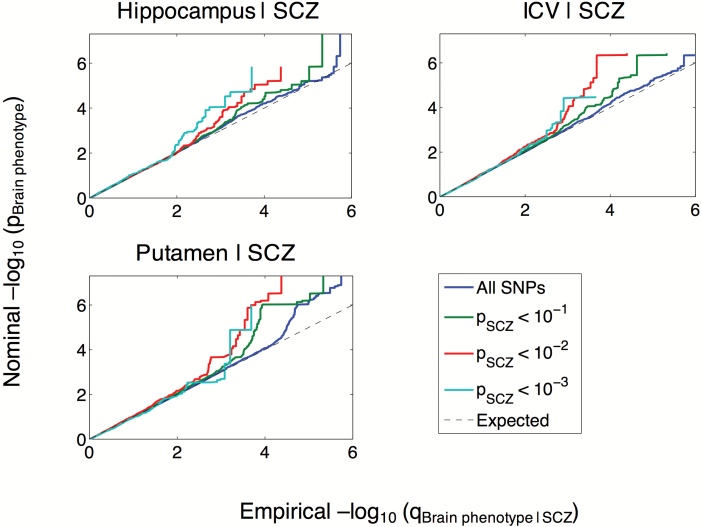
Fig. 1.
Conditional Q-Q plots of nominal vs empirical −log10P-values (corrected for inflation) in volumes of hippocampus, putamen, and intracranial volume (ICV) below the standard GWAS threshold of P < 5 × 10⁻⁸ as a function of significance of association with schizophrenia (SCZ) at the level of −log10(P) ≥ 1, −log10(P) ≥ 2, −log10(P) ≥ 3 corresponding to P ≤ .1, P ≤ .01, P ≤ .001, respectively. The blue lines indicate all SNPs. The dashed lines indicate the null hypothesis.

