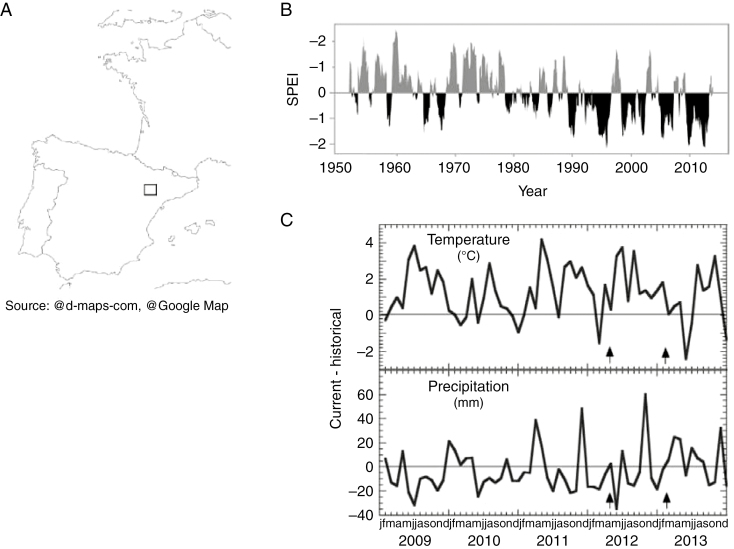
Fig. 1.
(A) Location of the study site. (B) Standardized precipitation–evapotranspiration index (SPEI) for years 1951–2013, calculated using a time scale of 12 months. Negative values (black) indicate water deficit (i.e. drought periods) while positive ones (grey) indicate water surplus relative to reference climatic conditions. Each SPEI value is calculated from the data of the last 12 months. (C) Difference between historical (1951–2000) and current (2009–13) mean monthly temperature and precipitation. Arrows indicate the two sampling dates (drought in April 2012 and post-rain in February 2013). Climatic data correspond to Zaragoza Airport, 90 km west of the Valcuerna study site. Source: Agencia Española de Meteorología (AEMET), Ministerio de Agricultura, Alimentación y Medio Ambiente, Gobierno de España.

