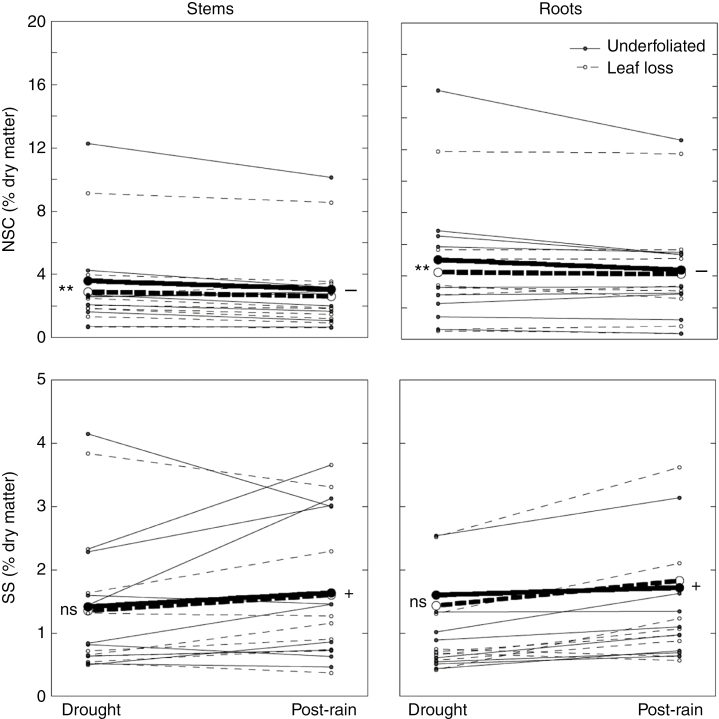
Fig. 2.
Changes between drought (April 2012) and post-rain (February 2013) periods of non-structural carbohydrate (NSC) and soluble sugar (SS) concentrations of the different species in stems and roots of plants with leaf loss and in undefoliated plants. Bold lines correspond to average values for all nine species (for detailed information for each species see Supplementary Data Fig. S1). The + and − symbols indicate a significant increase or decrease (P < 0.001), respectively, between periods, overall considering undefoliated plants and plants with leaf loss. **Significant difference (P < 0.001) between undefoliated plants and plants with leaf loss, overall considering drought and post-rain periods; ns, no significant difference (see Table 3 for the respective model results).

