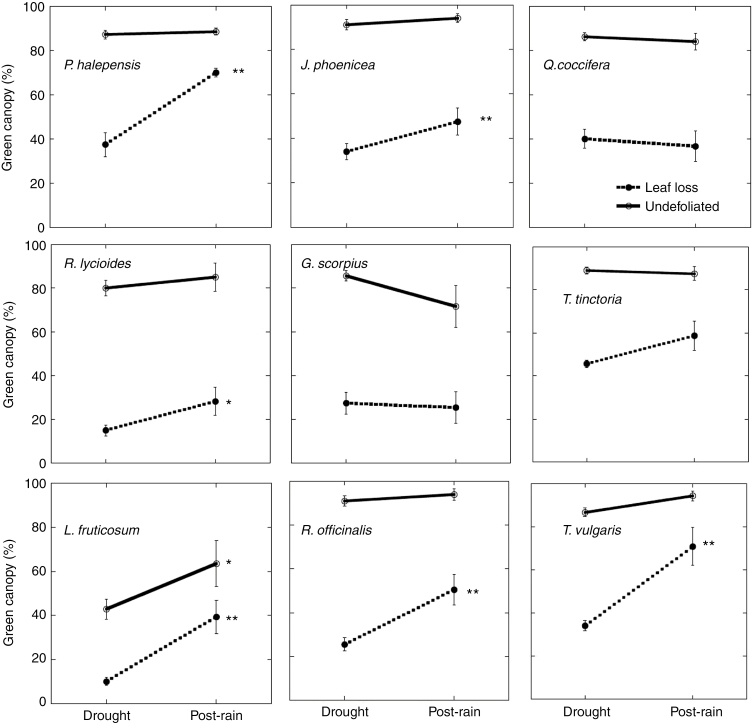
Fig. 3.
Mean percentage of green canopy during the drought (April 2012) and post-rain (February 2013) periods of plants of the different species. Values were obtained for the plants that were sampled in the post-rain period (N = 10 for each dieback state category). Error bars indicate s.e. *P < 0.05, **P < 0.01 (drought versus post-rain periods). Differences between undefoliated plants and those with leaf loss (dieback) were always significant (P < 0.01).

