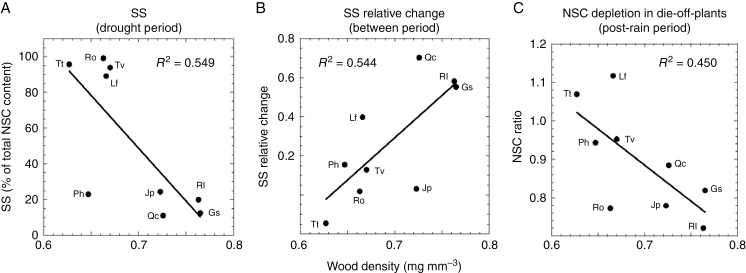
Fig. 5.
Relationship between wood density (WD) and (A) soluble sugars (SS) during the drought period (as a percentage of total non-structural carbohydrates, NSC); (B) relative change in SS between post-rain and drought periods (value in the post-rain period minus value in the drought period/value in the drought period); and (C) NSC depletion in plants with leaf loss, estimated as the ratio of NSC between undefoliated plants and plants with leaf loss in the post-rain period for each species. NSC and SS values were obtained by averaging stem and root values of all undefoliated and plants with leaf loss. R2 values correspond to linear correlation coefficients. Species abbreviations are as in Fig. 4.

