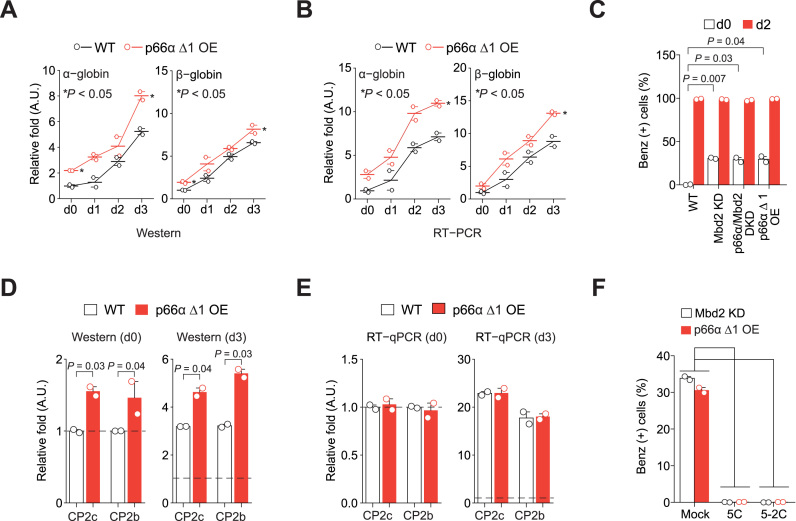
Figure 7.
Disruption of the Mbd2-p66α interplay in Mbd2-NuRD shows phenotypes analogous to Mbd2 downregulation. Quantification of the α- and β-globin expression in p66α Δ1 OE MEL cells by Immunoblot (A) and RT-PCR (B) analyses. n = 2. (C) Functional hemoglobin synthesis analysis by benzidine staining. n = 2. Quantification of the CP2c and CP2b expression in the p66α Δ1 OE MEL cells by Immunoblot (D) and RT-qPCR (E) analyses. D and E are values of the uninduced (d0) and induced (d3) states shown in Supplementary Figure S8B and C, respectively. n = 2. (F) Functional hemoglobin synthesis analysis by benzidine staining in undifferentiated Mbd2 KD and p66α Δ1 OE MEL cells, in the presence or absence of the peptides inhibiting the CP2c's DNA binding activity (5C and 5-2C). n = 2. The corresponding immunoblots of CBP proteins are shown in Supplementary Figure S8D.

