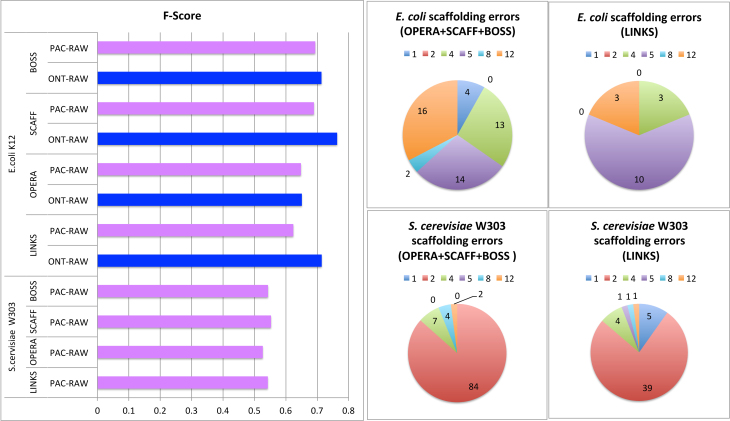
Figure 3:
Synthetic libraries scaffolding benchmark. The F-score (Methods section) was computed with the scripts provided by Hunt et al. [3] on the scaffold sequences produced by each scaffolding tool. The pie charts show the number of scaffolding errors for Links and for the short-read scaffolders fed with the Fast-SG alignments for both E. coli K12 and S. cerevisiae W303. The definition of the scaffolding errors (colors in pie chart) are provided in the Short- and long-reads benchmarks subsection

