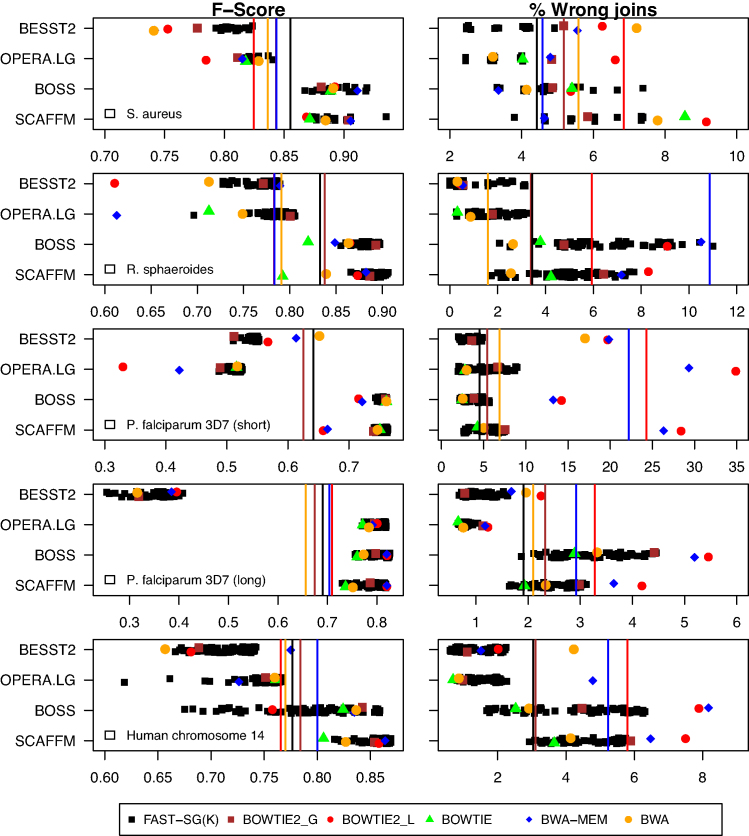
Figure 4:
Illumina scaffolding benchmark. Four real datasets (Table 1), five Illumina libraries, and four scaffolding tools were used to assess the performance of Fast-SG and the short-read aligners for building the scaffolding graph by means of an F-score metric and percentage of wrong joins (Algorithms section, and Supplementary Material 4). Fast-SG was run with various k-mer sizes in the range of k = 12–28, k = 12–70, k= 15–66, and k = 15–80 for Staphylococcus aureus, Rhodobacter sphaeroides, Plasmodium falciparum, and the human chromosome 14, respectively. Short-read aligners were run with the wrapper or instructions provided by the scaffolding tools when possible or using the default parameters. Single data points provide the F-score and error rate for each combination of scaffolding tool and aligner in each dataset. The vertical lines show for each dataset the average F-score or error rate values obtained by each of the short-read aligners or Fast-SG together with the four scaffolding tools. Vertical lines for Bowtie were not plotted since it cannot be used with Besst2. For the P. falciparum (short) dataset, the average F-scores (vertical lines) were omitted for Bwa, Bwa-mem, and Bowtie2-Local due to poor performance (high error rate). The commands used for the aligners and scaffolding tools are detailed in Supplementary Material 5.

