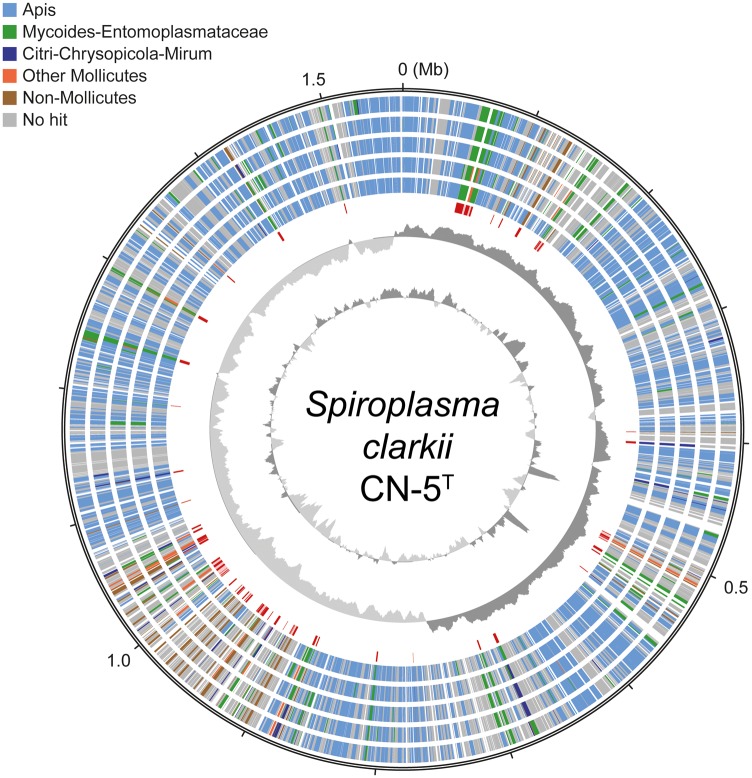
Fig. 2.—
Chromosomal organization of S. clarkii. Concentric circles from the inside out: 1) GC content (above average: dark gray; below average: light gray; two high GC peaks near the 0.5 Mb mark correspond to the rRNA gene clusters), 2) GC skew (positive: dark gray; negative: light gray), 3) locations of the high-confidence candidates of acquired genes (colored in red; putatively acquired islands with at least five genes from the same donor are highlighted with a pink background), 4–8) phylogenetic affiliations of the top five BLASTP hits from the NCBI nonredundant database (color-coded according to the legend), and 9) scale marks (unit: Mb).

