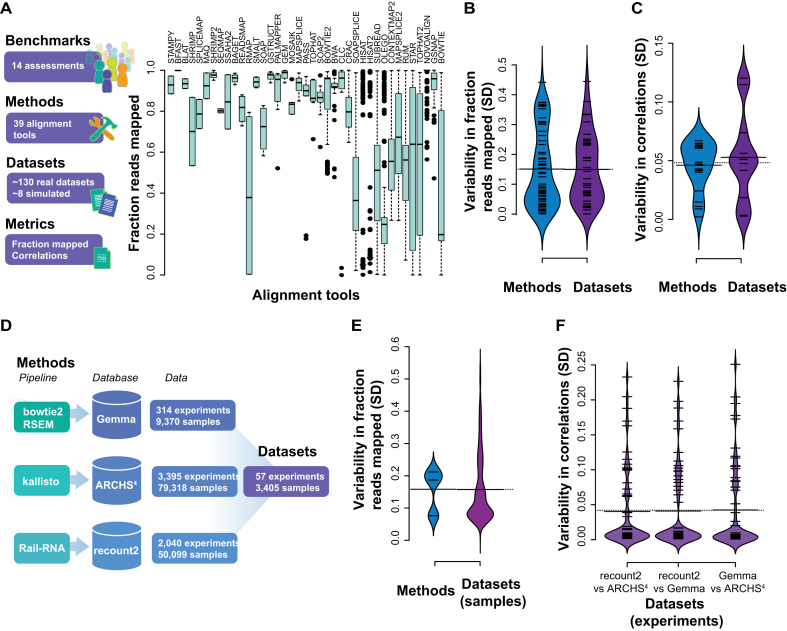
Figure 2.
Summary of previous studies of RNA-seq alignment evaluations. (A) Fraction of reads aligned for aligners across different tools, datasets (real and simulated) and parameters, ordered by number of times assessed. (B) SDs of the fraction mapped comparing averaging by dataset or by method. (C) Correlations of the relative expression levels of the output of different quantifiers in a subset of 5 benchmarks. (D) Summary of databases and pipelines used in the global assessment. Overall, 57 experiments and 3405 samples were used in the assessment. (E) SD of fractions reads mapped per database and those across the three databases (per sample) (F) and correlations of the expression levels between the different databases (SDs per experiment).

