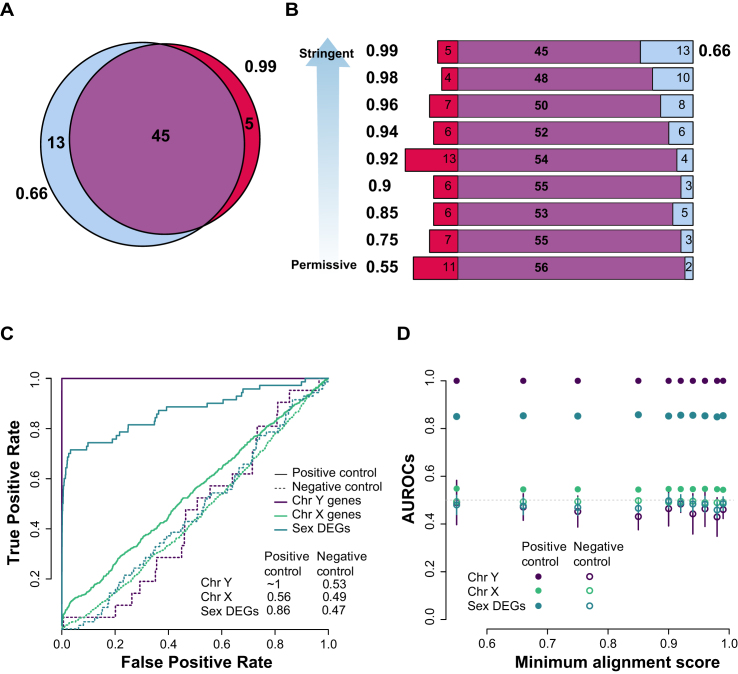
Figure 4.
Differential expression by sex in the GEUVADIS dataset. (A) Overlap of all DE genes (FDR < 0. 05 and |log2 FC| > 2) for the default minAS = 0.66 and extreme minAS = 0.99 (B) and then across parameters with the default parameter. (C) ROCs for each set using average rank of the fold change and the adjusted P-value (see Materials and Methods). (D) AUROCs across the minimum alignment parameters for the two gene sets tested for both negative and positive controls. These are averaged across 10 runs of the analysis, sampling 200 males and 200 females from the totals.

