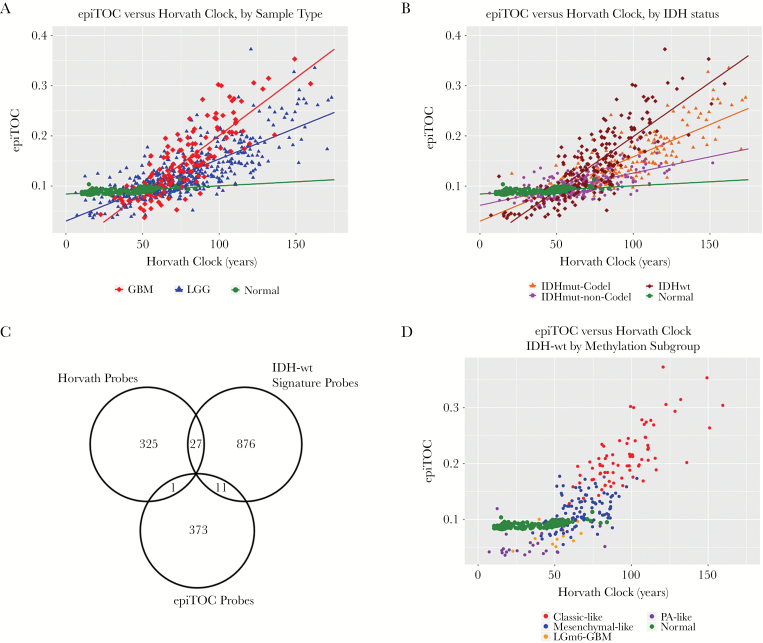
Fig. 2.
(A) All glioma samples with epiTOC age plotted against Horvath clock age, color coded by WHO grade. (B) All glioma samples with epiTOC age plotted against Horvath clock age, color coded by IDH-mutation–1p/19q codeletion status. (C) Overlap between methylation probe sets used to calculate Horvath’s clock and epiTOC and used in supervised subtyping of IDH-wt gliomas. (D) IDH-wt samples with epiTOC age plotted against Horvath clock age, color coded by methylation cluster subtype.

