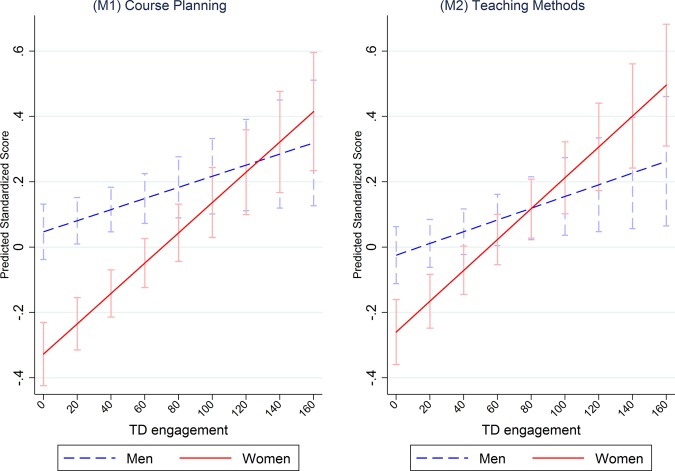
FIGURE 2.
Predictive margins of each college teaching self-efficacy factor with 95% CI for the level of TD engagement by gender. Predicted scores were estimated from each analytic model presented in Table 3A (Supplemental Table 6). Each x-axis unit represents 1 hour.

