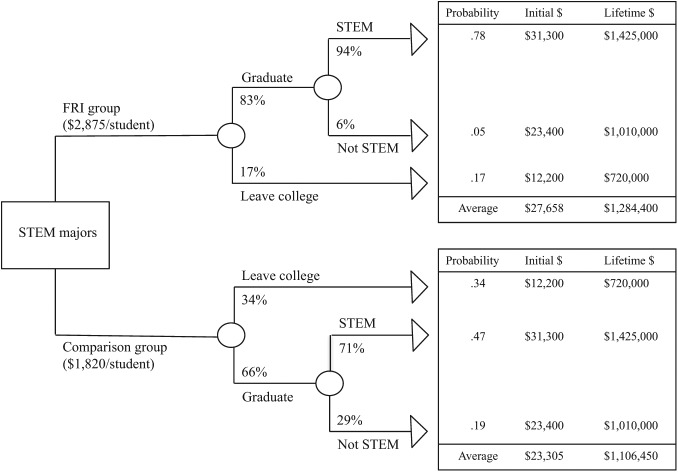
FIGURE 2.
Decision tree model for the costs and benefits of FRI vs. the comparison program. The potential population of FRI is STEM majors at a decision node (rectangle on left), who either become part of the FRI or comparison group. Chance nodes (circles) are points where the population has different likelihoods of pursuing different paths on the way to realizing different outcomes (triangles). The percentages of the population that proceed on each path are noted next to the path. The probability of each outcome occurring is calculated by multiplying the probabilities at each chance node (i.e., the percentages) associated with that path. The average cost and benefit of each path can then be calculated and compared (on right).

