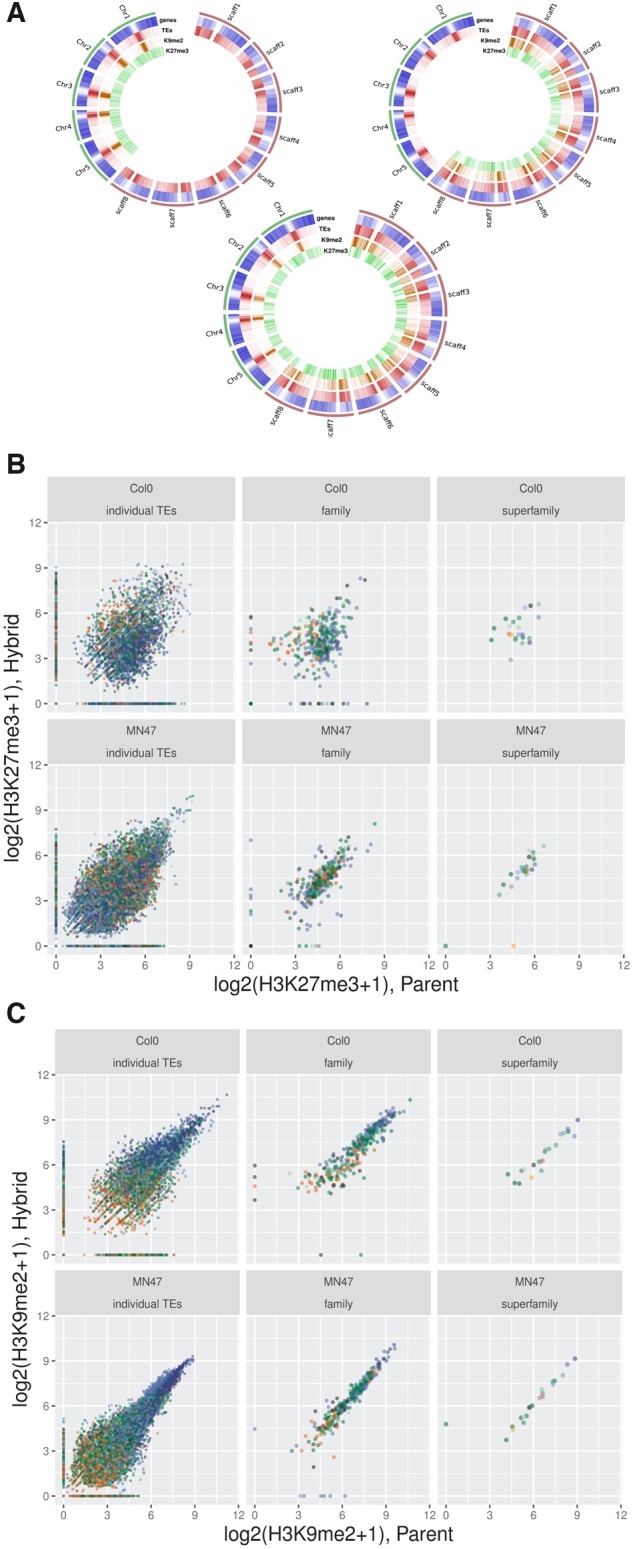
Fig. 3.

—Correlation of histone mark levels on TEs in parent and hybrid. (A) Genome-wide distribution of H3K9me2 and H3K27me2 on the parental and hybrid genomes. The circular plots represent the hybrid genome used as reference, with the five A. thaliana chromosomes in green and the eight A. lyrata chromosomes in red. Inner tracks represent gene, TE, H3K9me2 and H3K27me3 densities in 500 kb bins. Top left: Col-0, Top right: MN47, Bottom: hybrid. (B and C) Scatterplots of ChIP-seq read counts. The color code indicates superfamily membership, using the palette of figure 2. (B) H3K9me2; (C) H3K27me3.
