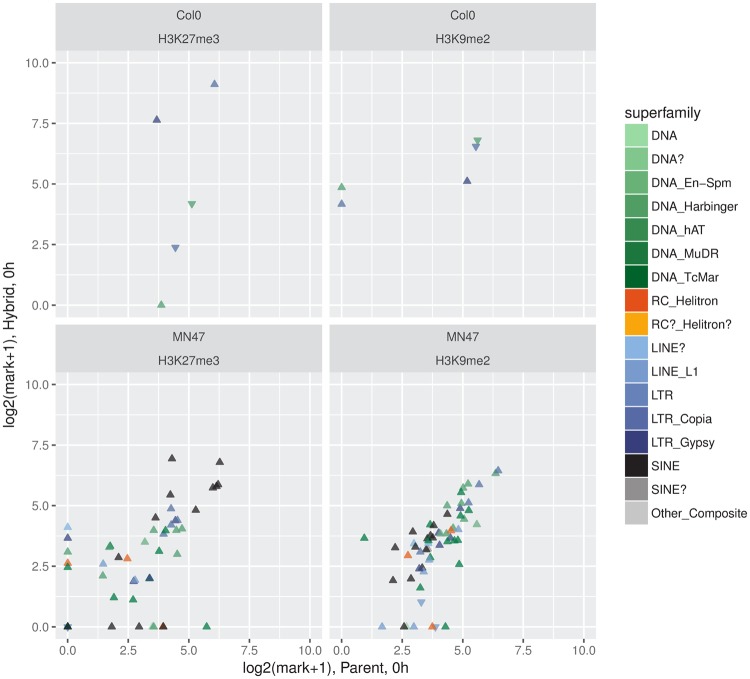
Fig. 4.
—No change in histone mark occupancy is detected for differentially expressed TEs. Shown are scatterplots of each histone marks on each of the two genomes for TEs with significantly different expression level in parent versus hybrid under standard conditions. Superfamily membership of the TEs is indicated using the palette of figure 2. Symbol shapes indicate the direction of gene expression change in hybrid versus parent (upward triangle: up, downward: down).

