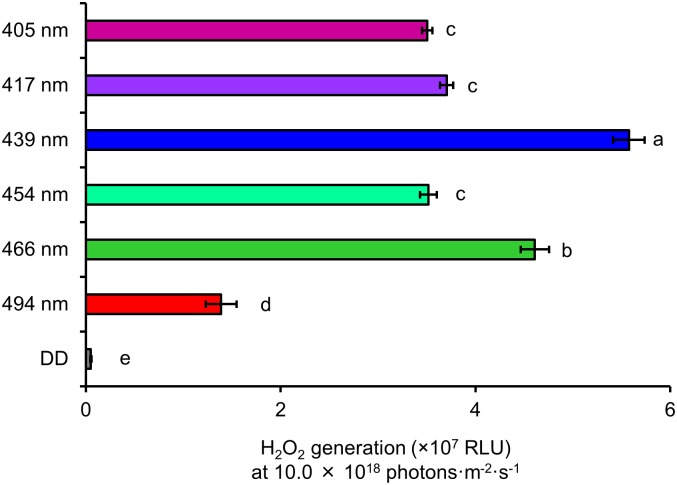
Fig 8. Comparison of H2O2 generation among the wavelengths of blue light at 10.0 × 10¹⁸ photons·m-2·s-1.
Data are mean ± standard error. Different lowercase letters next to bars indicate significant differences (Tukey’s test, P < 0.01). RLU indicates the amount of luminescence. DD: 24 h dark conditions.

